How are your YouTube campaigns performing on TV screens?
Monitoring performance and making adjustments when necessary is important to do now, as the TV screen device type will be growing.
Only a few months ago, Google announced TV screens as a device type advertisers could target for their video campaigns in Google Ads. And this month Ginny Marvin explained that “The TV screens device type targets YouTube channel inventory on smart TVs, set top boxes, gaming consoles and streaming devices such as Apple TV, Chromecast and Roku.” While TV screens may not be the dominant device type for your video campaigns, you should at least have it on your radar to monitor device growth. Let’s check out a few ways you can keep an eye on how your YouTube videos perform on TV screens.
Use the device segmentation in Google Ads
We have two options when viewing our device data for video campaigns within Google Ads. The first option is to select the Devices report when you’re in your campaign or ad group.

My biggest gripe with this route is Google Ads doesn’t give me all of the proper YouTube columns I like (view percent, earned metrics, others) when I’m in the Device view. We pretty much have view metrics. In this example, I can see TV screens might only make up 1.3 percent of views, but they have the best view rate. I’ve then gone on and added an increase bid modifier to try and get as many views I can from TV screens.
The second option we can use in Google Ads, and my preferred option, is to look at the campaign view and then segment by device.

Because I’m in the campaign view, Google Ads gives me the columns I prefer to check on for my video campaigns. I can now see how long people watch on TV screens. I can also see how many earned actions users take after interactive with a paid video ad. This information is going to be a lot better for me to review to make proper bid adjustments.
Wait. I haven’t run ads yet. Can I still see this data for my YouTube videos?
That’s a great question. You might be new to video campaigns and want to get an understanding of how users consume your content before launching any campaigns. If this is the case, and assuming you already have videos live on your channel, the first place you should check is your YouTube Analytics.
Once you’re in your YouTube Analytics (which should default to the YouTube Studio BETA), click on the “Analytics” option in the left-hand menu to pull up some basic video stats. Next, click anywhere in the first graph you see in the Analytics view.
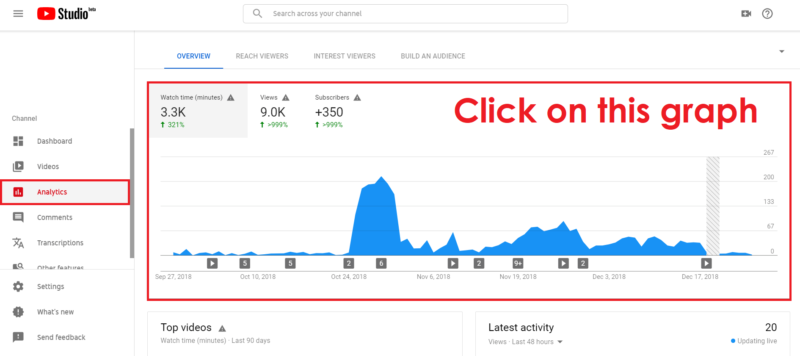
After you click on the graph, you’ll be taken to a different screen giving you some basic stats on how each of your videos is performing depending on the date range. The top menu for this page gives you several options to segment your user data, but for this post, we will want to select the “Device Type” option.

We will then see a screen similar to this image…
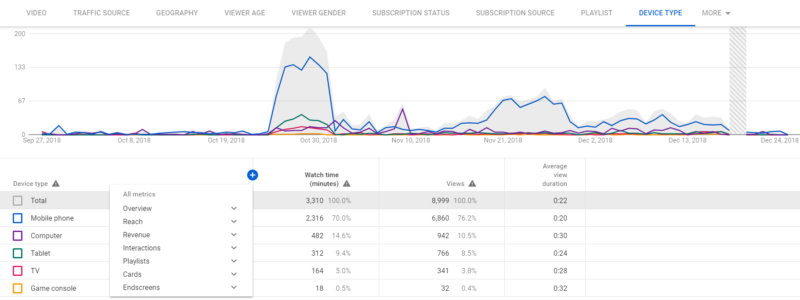
Now we can see device stats for all of our videos during the date range we have chosen. Again, this is showing all video performance, not just your video ad campaigns. You can see there is a separate report for “Traffic Sources” in the navigation. One thing also included in the image, is the menu of columns you can select from after clicking on the blue plus button. There are several column options you have to data-dive into how TV screens could be performing depending on the goals of your video are.
Looking at the same image, we can see TV screens make up only 5.0 percent of total watch time. But curious me is going to add other columns to see if TV screens get better subscribers, or maybe even a better rate of likes or shares. If I find that is the case, I might consider proactively setting my bid adjustments before launching anything new. Or I might be comfortable structuring my campaigns differently to try and capitalize on better performance as early as possible. I can’t give you a concrete answer on the best option because your data will have to be the guide.
YouTube usage on TV screens will only grow
In the link to the Google blog I referenced in the first sentence of this post, you can find the stat that users watch over 180 million hours of YouTube on TV screens every day. Now add to the mix how cutting the cord with cable TV is growing as users switch to alternative services like Amazon Prime Video, Hulu and yes…YouTube TV. I am not saying you must stop everything you are doing to push your videos on TV screens, but you should at least be monitoring the performance and making the proper adjustments when necessary. The TV screen device type will be growing in the years to come.
Contributing authors are invited to create content for Search Engine Land and are chosen for their expertise and contribution to the search community. Our contributors work under the oversight of the editorial staff and contributions are checked for quality and relevance to our readers. The opinions they express are their own.
Related stories
New on Search Engine Land
About the author