NetRatings: Google Spike, Live.com Rise In February 2007
Earlier I wrote of the latest search popularity stats out from Hitwise and said those from other companies would be coming. Next up, Nielsen//NetRatings. The most recent figures out (PDF format) for February 2007 from NetRatings show a significant Google gain at Yahoo’s expense. Live.com also shows a notable gain. But the figures also show […]
Earlier I wrote
of the latest search popularity stats out from Hitwise and said those from other
companies would be coming. Next up,
Nielsen//NetRatings. The most recent figures
out (PDF format) for
February 2007 from NetRatings show a significant Google gain at Yahoo’s expense.
Live.com also shows a notable gain. But the figures also show the "search pie"
itself grew massively.
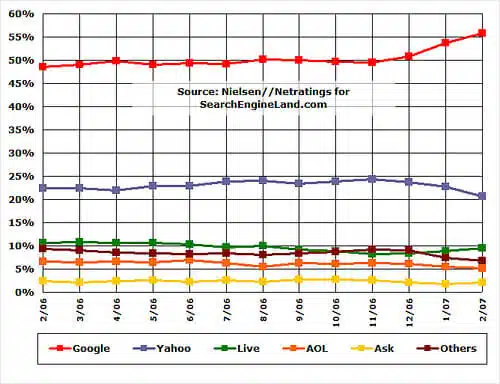
Here are the figures for February 2007, showing the estimated percentage of
all home and work searches done in the United States that were handled by each
search network:
- Google: 55.8%
- Yahoo: 20.7%
- Microsoft Live: 9.6%
- AOL: 5.1%
- Ask: 2.0%
- Others: 6.8%
Here’s a look over the past year:
The trend shows that Google, relatively steady over the past year, suddenly
gained about 5 percent of the overall "pie" of searches happening. It rose from
49.5 percent in November 2006 to 55.8 percent in February 2007.
Yahoo, also mostly steady over the past year, showed a drop at the same time.
It decreased from 24.3 percent in November to 20.7 percent in February 2007.
As for Microsoft, after nearly of year of steady declines, it posted three
months of consecutive growth, rising from 8.2 percent in November 2006 to 8.4
percent in December 2006, then 8.9 percent in January 2007 to 9.6 percent —
nearly a full percent gain — in February 2007.
I wrote before on
how Compete was also showing a Microsoft gain while Hitwise didn’t. Now we have
a second rating service finding a Microsoft rise. I’ll be looking at comScore
figures next.
As for Yahoo, an important note. While it showed a drop in share — a
substantial drop — it’s important to note that the raw number of searches
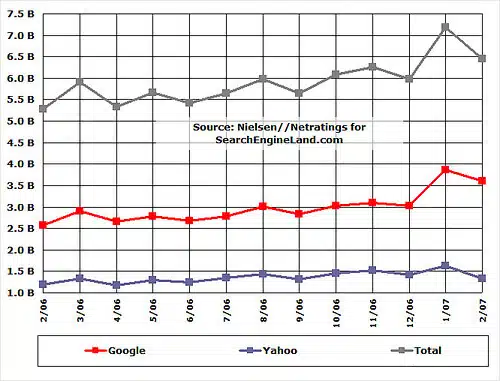
remained pretty high. Consider this chart below:
In that chart, I’ve zoomed in on the number of searches conducted at Google
and Yahoo over time, as well as total searches. This is in contrast to the
percentage of total searches. The chart shows billions of
searches (and thanks to
this advice on how
to get billions to show in Excel without all those zeros):
See how in January 2007, total searches suddenly shot up from the 5.5 to 6.0 billion
range it had been at for several months to over 7 billion searches? See also how
that’s nearly the same amount of increase on Google? Somehow, Google gained about a billion new searches that hadn’t been part of the search pie
before. My guess is that this comes from YouTube traffic being counted as
"search" traffic for the first time and added
into Google figures [NOTE: NetRatings tells me no, more coming]. As a result, Google is seen as having a bigger share of the
existing pie even though Yahoo hasn’t lost that much search traffic.
I’m not taking away from the fact that Yahoo saw a decline. It did. It went
from 1.5 billion searches in November 2006 to 1.3 billion in February 2007. But
the percentage of overall share can be misleading if you suddenly have the
search pie expand. In January 2007, Yahoo had a 22.7 percent share of that pie
— a drop from the previous month, as the share trend chart shows. However, it
also had 1.6 billion searches, a rise over the previous month and more searches
than it had compared to any month on the previous year.
I’m checking with NetRatings about what caused the search pie to expand so
dramatically in January in Google’s favor and will postscript here when I hear
back.
Postscript: NetRatings sent me this:
As with every year, the release of our January data includes updates to our annual population and universe estimates. Also, as part of our ongoing commitment to accurate representation of the market, we occasionally make adjustments to our panel weighting targets. These targets are important to monitor and update as appropriate because they help ensure that the activity of our panelists reflects the real activity of the universe(s) we measure. With the January dataset, we made minor adjustments to our behavioral weighting targets. The actual impact on the data is nominal, and the month-over-month & year-over-year changes in activity are based on real and verifiable consumer activity. This change ensures stability and accuracy in each of our MegaView reports.
Contributing authors are invited to create content for Search Engine Land and are chosen for their expertise and contribution to the search community. Our contributors work under the oversight of the editorial staff and contributions are checked for quality and relevance to our readers. The opinions they express are their own.
Related stories

