How to boost PPC retargeting efficiency with an RFM analysis
Stop wasting ad spend on the wrong audiences. Use RFM analysis to identify your most valuable customers and optimize your PPC campaigns.
Want to stop wasting ad dollars on the wrong customers? Learn how RFM analysis can transform your PPC retargeting by identifying your most valuable audiences – from VIP customers to those at risk of churning – and tailor your campaigns for maximum ROI.
What’s an RFM analysis?
In a nutshell, an RFM analysis helps you classify customers based on their purchasing behavior.
RFM stands for:
- Recency.
- Frequency.
- Monetary value.
Recency
How long ago did the customer last make a purchase? The more recent the purchase, the more active the customer is considered, increasing your chances of successfully re-engaging with them.
Frequency
How many sales did those customers make over a given period? Again, the higher the purchase frequency, the more loyal the customers and the higher the lifetime value (LTV).
Monetary value
How much do those customers spend per purchase, on average? Once more, the higher that number, the more valuable the customers.
Why RFM segmentation matters
In an ideal world, all your customers would purchase recently, frequently and with a high average order value. However, reality rarely aligns with this perfect scenario.
That’s where RFM segmentation comes in – analyzing customers’ purchase history to prioritize certain groups, tailor messaging and create targeted retargeting lists for more effective campaigns.
Here is an example of a very basic RFM segmentation:
| Segments | Recency | Frequency | Monetary Value |
| VIPs | Recently bought | Purchase frequently | High spender |
| First customers | Recently bought | Did not purchase before | Spend moderately |
| Bad customers | Did not buy recently | Do not purchase frequently | Low spender |
From a high-level perspective, running an RFM analysis allows for increased personalization and optimization.
For example, you can identify your most loyal customers versus those at risk of churning. Once that’s done, you can customize campaigns accordingly (exclusive benefits, promotions, loyalty programs, etc.).
From a PPC, hands-on perspective, here are some examples of RFM-based actions:
Better segment retargeting audiences
- VIPs: Reward recent customers with higher-than-average spend and frequency (VIP events, exclusive deals, early releases, etc.).
- Frequent buyers: Exclude high-frequency customers from overly aggressive campaigns to avoid brand fatigue and save on ad budgets.
- Customers at risk: Reengage past customers who did not buy recently (win-back, special offers, etc.).
- Bad customers: Experiment with past customers who did not repeat purchase (diversify products, etc.) and potentially exclude them altogether.
Enhance ad copy and creative
- Customers at risk: Switch to more urgency-driven language to get those past customers to buy again (“20% off now with this ad only!”).
- VIPs: Use a warmer, more appreciative tone of voice for loyal customers to keep a special relationship (“For Our Best Customers Only”, etc.).
- Low monetary value customers: Exclude consistently low monetary value customers from premium product campaigns.
- Great customers: Turn great customers (not quite VIPs but already showing promising signs) into ambassadors, encouraging them to leave reviews. Or offer them to enter a loyalty program / membership deal.
Create more granular seed lists
- Bad customers: Exclude Lookalike audiences based off of those customers.
- VIPs: Include Lookalike audiences based off of those customers.
When not to use an RFM analysis
While powerful, just like any method, an RFM analysis has limits:
Low-frequency products / B2B
Frequency becomes irrelevant for products typically purchased only once, such as funerals or specialized industrial equipment, rendering RFM analysis unsuitable for these cases.
Similarly, long B2B sales cycles, with their lower interaction frequency, limit the effectiveness of this approach. In such scenarios, alternative segmentation methods are more appropriate.
Recurring products
Conversely, with subscription-based services (i.e., Netflix), recency and frequency cannot matter since they happen by default. Instead, monitoring renewal rates or service usage will have more value.
Similarly, with highly seasonal products (i.e., Christmas gifts such as gift cards), an RFM analysis will lack depth. Instead, you will want to use seasonal KPIs.
Forecasting results
An RFM analysis looks at historical data and is not meant to predict future behavior. If that’s your goal, you will probably want to run regression analysis or time-series forecasting.
Running an RFM analysis: What data do you need?
The first step in conducting an RFM analysis is gathering the necessary data. At its core, all you need is a straightforward table containing:
- Customer IDs.
- Transaction dates.
- Transaction values.
While additional details like currencies, product categories or locations can be helpful, it’s best to start with this simple foundation.
One tricky aspect is determining the reference period. The ideal timeframe depends on your industry, product lifecycle and customer buying habits.
However, because RFM analysis relies heavily on purchase frequency, it may not be suitable for industries like real estate or automotive sales.
In general, you should use at least one to two years of data, particularly for frequently purchased products.
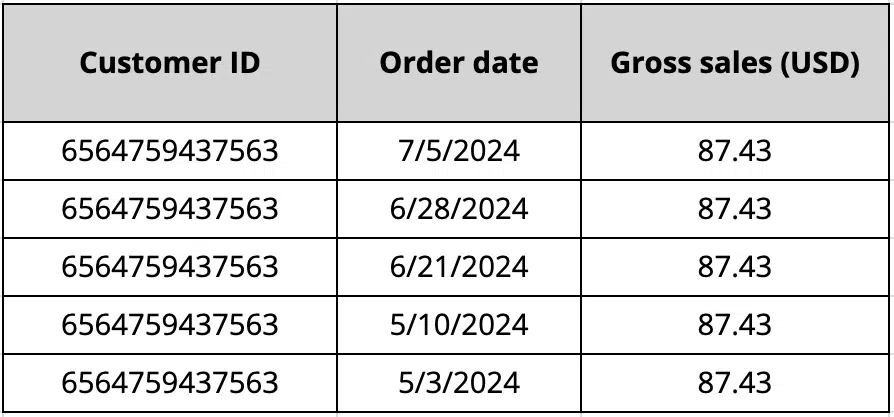
Here is an example of such a data pull for a single customer ID:

How to calculate RFM scores
The beauty of RFM analysis lies in its simplicity. RFM scores are straightforward to calculate based on three key criteria: recency, frequency and monetary value. Here are a few examples:
- Basic: 1 to 3 score for each criterion = 27 distinct cells (3 x 3 x 3).
- Somewhat refined: 1 to 5 score for each criterion = 125 distinct cells (5 x 5 x 5).
- Super refined: 1 to 10 score for each criterion = 1,000 distinct cells (10 x 10 x 10).
- Super basic: 5 primary cells (VIP, loyal, big spenders, new customers, at-risk).
Depending on your needs, advanced techniques like machine learning or algorithmic approaches can help determine the optimal number of segments.
However, that’s not the primary focus of an RFM analysis. Its value lies in being straightforward and practical, allowing you to get started quickly.
Specialized segmentation methods are typically employed for large-scale retailers like Amazon or Walmart. But for now, let’s keep it simple with a basic, concrete example using Excel.
Recency
Sort your table by customer IDs and then by date (most recent first).
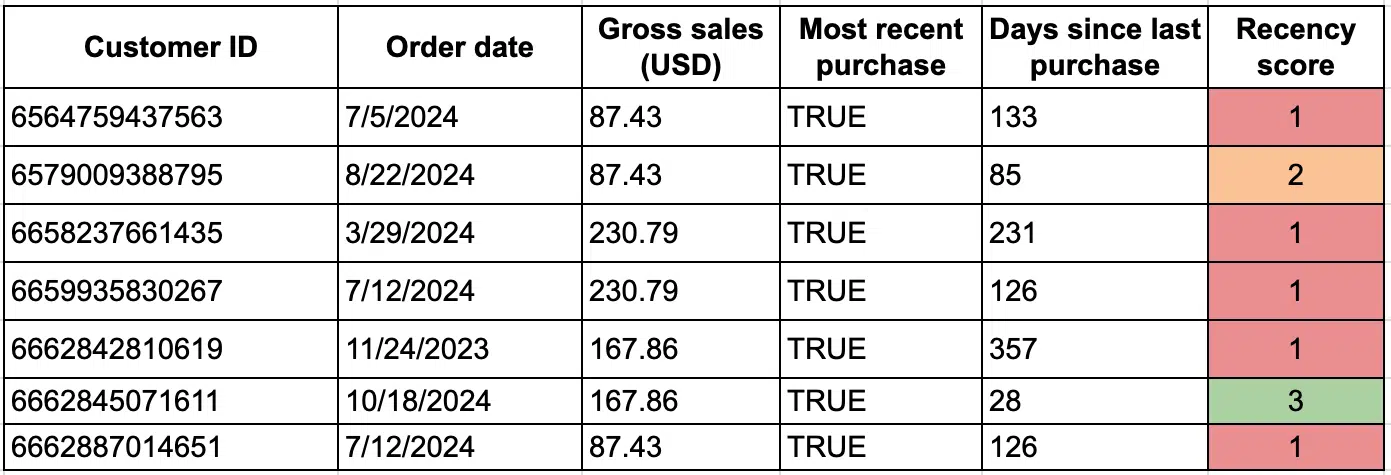
Add a column to identify whether this row is the last purchase (a simple IF formula will do that trick). Then, add another column to calculate the amount of days since the last purchase.
Finally, define groups based on your project. For example:
- Last purchased in the last 30 days: 3
- Last purchased between 30 and 90 days ago: 2
- Last purchased before that: 1
Here is what it might look like:

Frequency
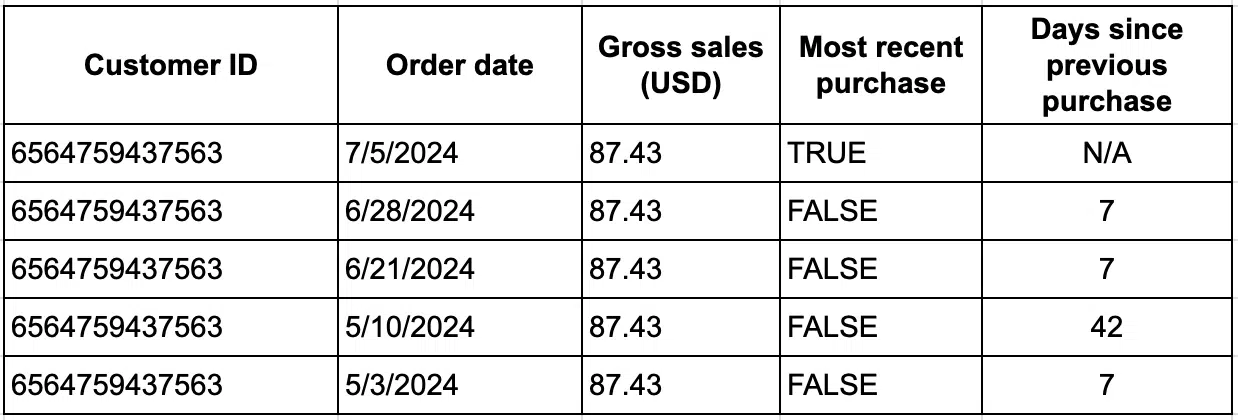
Add another column (“Days since previous purchase”) to your basic table: if it’s the last purchase from that customer ID, skip it.
Otherwise, subtract the last purchase date from the next purchase date. Here is what it might look like:

Take your customer IDs column and copy and paste it elsewhere, then deduplicate it.
Run an AVERAGEIF formula on your original table, averaging from the “Days since previous purchase” column. For the above customer ID (6564759437563), you should get 15.75 days.
Once more, using a basic segmentation, you could do something like:
- Purchases at least once a month: 3.
- Purchases every 31 to 90 days: 2.
- Last purchased before that: 1.
Monetary value
Copy and paste your customer IDs elsewhere, then deduplicate them again.
Run another AVERAGEIF formula on your original table, averaging from the “Gross sales (USD)” column. For the above customer ID (6564759437563), you should get 87.43.
One last time, using a basic segmentation:
- Average order value > $200: 3.
- Average order value between $150 and $200: 2.
- Average order value below $150: 1.
About averages
I made this simple by using average formulas. Naturally, depending on your industry, customer journey length, catalog size, etc., it could be interesting to refine this further using the median (or percentiles) instead of the mean (average).
What does the final output look like?
Now that you have all your RFM scores calculated, simply run VLOOKUPs to get a table of unique customer IDs + their RFM scores.
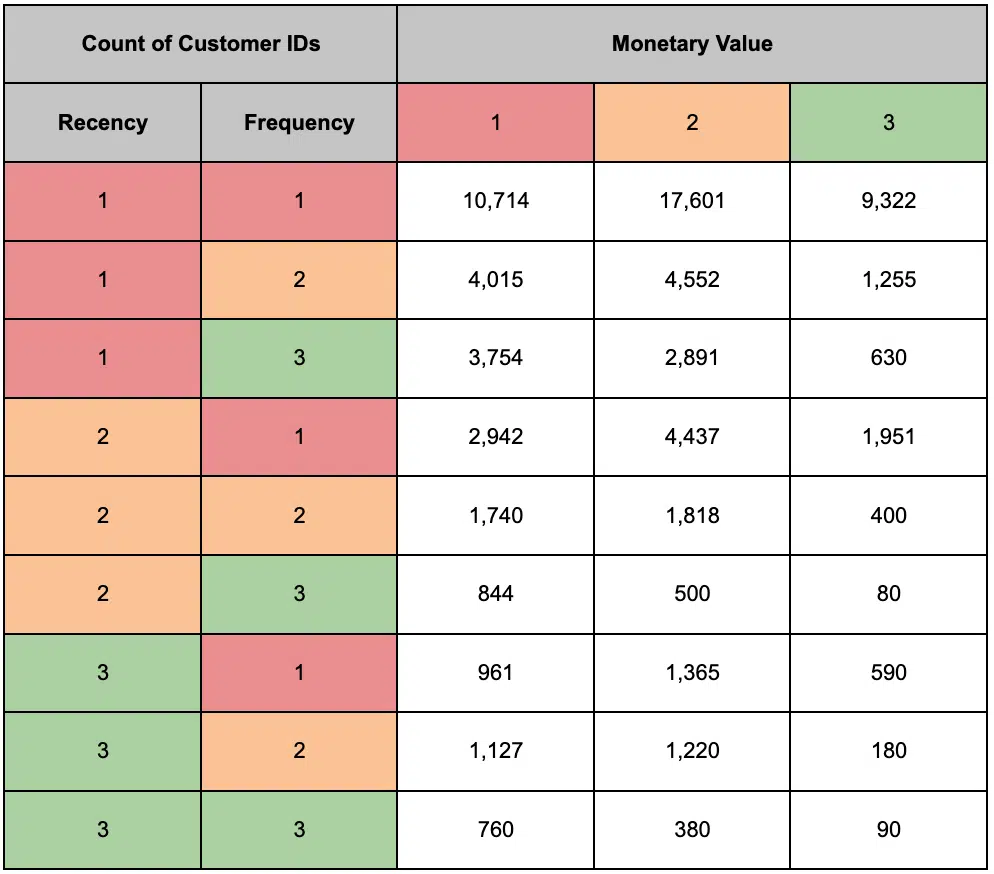
Most certainly, you should end up with much more 1s than 3s. Run a pivot table to get an overview of your scoring distribution quickly. You should get something like this:

As you can see, some segments may be too small to target effectively, so it’s important to dynamically adjust your scoring system to make it more usable on platforms like Google Ads. However, these smaller segments can still be valuable for other tactics like email or SMS campaigns.
For instance, the “all-stars” segment (ranked 3 on all three RFM metrics) may only consist of 90 customers, but it’s still worth exploring, even if retargeting isn’t an option.
Another approach is to group RFM scores together. For example, you can combine segments with a total RFM score between 7 and 9, which could create a group of 4,830 customer IDs. While this reduces the granularity of your analysis, it makes your insights more actionable, especially for ads or VIP campaigns.
With these refined buckets, the possibilities are endless. You can tailor target audiences, craft personalized messaging, and fine-tune your campaigns to maximize results.
RFM segmentation: The key to smarter customer targeting
RFM analysis is a simple yet effective way to segment customers based on their buying habits.
By using recency, frequency and monetary value scores, you can enhance retargeting campaigns, from segmentation to ad copy and product offers.
While it may not be suitable for every business model, RFM is an accessible and valuable tool worth trying.
Contributing authors are invited to create content for Search Engine Land and are chosen for their expertise and contribution to the search community. Our contributors work under the oversight of the editorial staff and contributions are checked for quality and relevance to our readers. The opinions they express are their own.
Related stories
New on Search Engine Land