Study: Comparing the data from 8 SEO tools
Spoiler: The numbers you'll find don't match up. SEO metric tools are for general trend analysis and competitor benchmarking, not on specific numbers.
Have you ever had a client (or boss) that called out discrepancies between the SEO tools you use?
As an SEO, it’s tough to have that conversation. Nobody likes to hear, “Well, these tools all measure things in different ways and are never 100% … yada yada yada.”
To non-SEO people, this feels like a convenient cop-out to answering a simple question: “Why can’t you give me accurate data?”
Having had this conversation so many times over the past decade, I decided that I wanted to compare the different outputs between tools to determine if there were any consistencies or generalizations that can be made when reporting and making decisions.
For example: I want an SEO to be able to say, “According to SEMrush, this is the total number of Page 1 keywords you rank for. Keep in mind that SEMrush, on average, reports a 25% lower (or higher) number of keywords than the average SEO tool.”
I also wanted to be able to demonstrate that the data from SEO tools shouldn’t be taken for gospel, but rather, they should be used for broad trend identification and quick-and-dirty competitor analysis.
Disclaimer: This research and its results are certainly not intended to favor or discredit any particular SEO tool. They all have areas of strength and weakness, and when used to complement one another, can be quite powerful. In this test, we are only looking at three outputs, so it’s important to understand the limitations of this data.
So let’s see what I found…
How I set up the test
I looked at three main metrics for comparison across tools:
- Linking root domains.
- Domain organic keywords ranking 1-10 in U.S. search.
- Bonus: Estimated monthly search traffic (Work in progress).
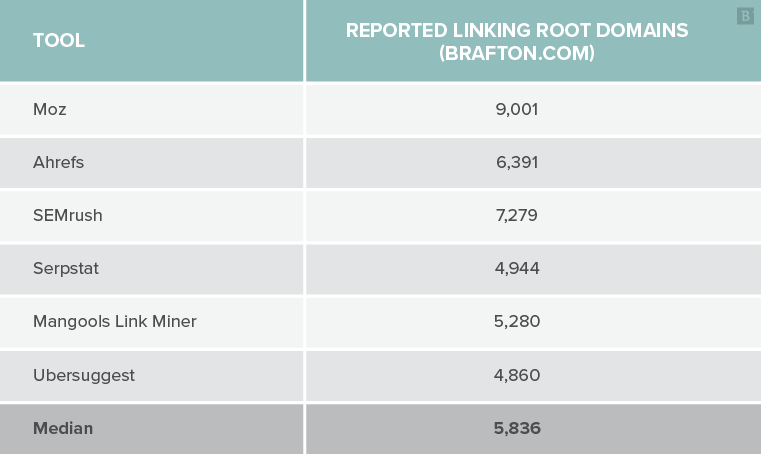
I took a website and compared the outputs from various SEO tools. For example, the following chart shows what each tool reported for my agency’s total linking root domains:
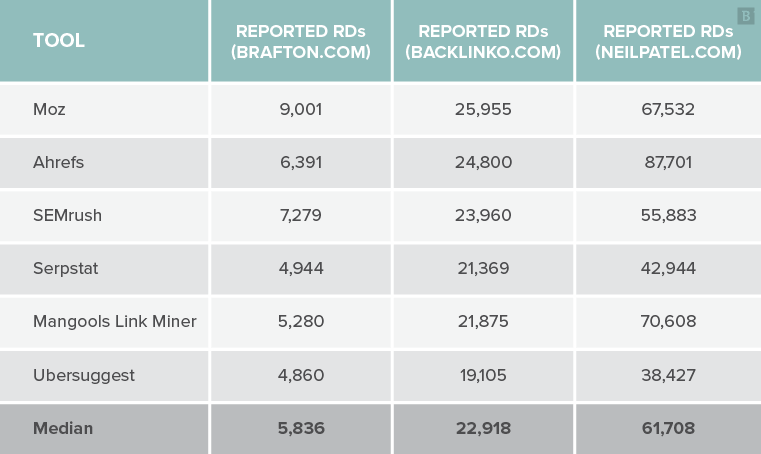
I then added nine other domains and compared their outputs to get a larger sample size. Example of three domains:
I then compared the output differences relative to the median for each tool and domain for each of the 10 domains.
For example, the median reported number of root domains for my agency was 5,836. Mangools reported 5,280 RDs, which is 10% less than the median.
Here’s an example of this comparison to the median reported RDs:
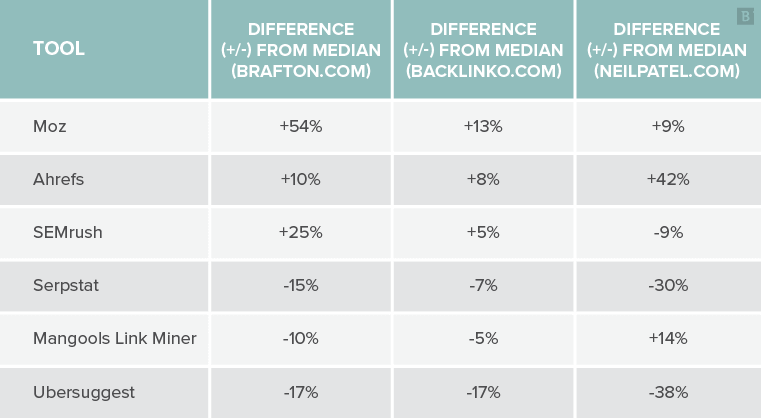
What this shows is that Moz reported a higher number of RDs than the median these three sites. Inversely, Ubersuggest reported fewer RDs than the median for each of the same three sites. Make sense?
This is a simple way of answering the question: “Does X tool generally report more or less data than other tools?”
Lastly, I calculated the average difference from the median for each tool across each site. This helped answer the question: “Across each of the 10 sites evaluated, which (if any) tools consistently reported lower/higher numbers than the median? By how much?”
This single number should give us an indication of whether a tool reports less, the same, or more data than the median.
Study qualifications
In tests like this, more data is always better than less. In this case, I’ve used 10 domains to attempt to answer the questions above. Certainly a larger scale study would yield more accurate results, and perhaps an ambitious SEO with more time and resources will conduct such a study someday.
Please understand that the following data is meant to be a conversation starter rather than a conversation ender. It is intended to paint the beginnings of a picture rather than be definitive.
Qualifications out of the way, let’s take a look at the results.
Root domains
We keep close tabs on the number and quality of root domains linking to our domains because strong backlink profiles correlate with ranking potential. We also monitor our competitors’ backlink profiles for benchmarking purposes.
So, if you intend to benchmark your site against your competitors, it’ll be an added benefit to know if the tool you’re using typically reports a lower or higher number than other tools. As you’ll see from the data below, you’ll also want to make sure you use the same tool to compare sites.
Caveat: Mangools reported a 392% outlier, which I suspect is a glitch. I have omitted this outlier in an effort to keep the data representative.
Here are the results from each domain:

By just eyeballing these charts, you can see that Moz tends to report a significantly higher number of root domains than the median. Ubersuggest seems to consistently report a lower number of root domains than the median.
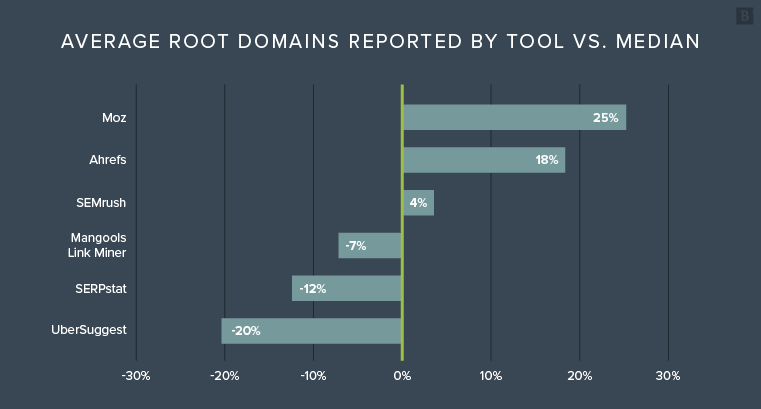
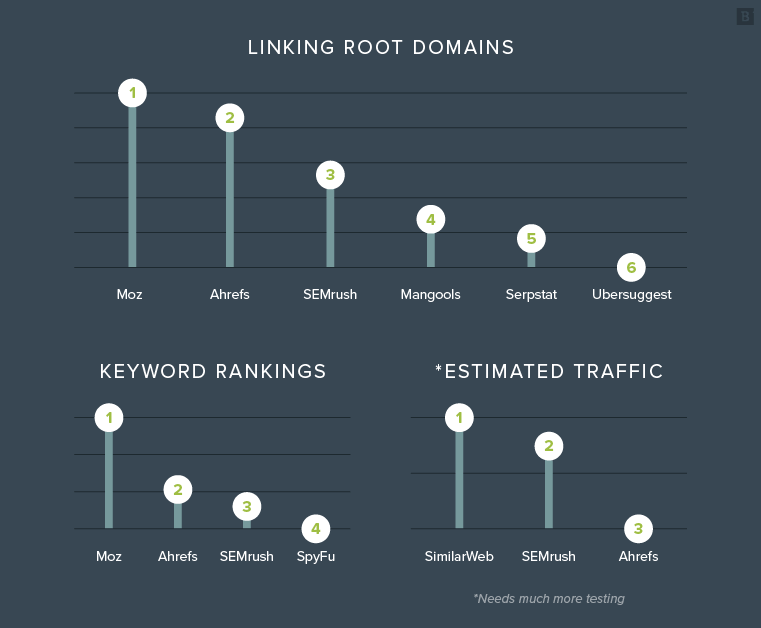
Here’s what the average linking root domain reporting looks like for each of the tools:
So, what does this information tell us?
On average, Moz and Ahrefs reported a higher number of root domains than competitors. SEMrush reported almost exactly at the median. Mangools, SERPstat and Ubersuggest reported relatively fewer root domains than the median.
While the sample size is small, there is a clearly observable trend:
- Ahrefs reported more linking root domains than the median 100% of the time.
- Moz reported more linking root domains than the median 90% of the time.
- Ubersuggest reported fewer linking root domains than the median 100% of the time.
With this data, we can say that it is likely (not guaranteed) that Moz and Ahrefs will report more linking root domains than the other tools, while Ubersuggest and to some extent SERPstat will report fewer linking root domains.
Does this make one tool better than another? Not necessarily, but it sure adds context.
Winners: Moz and Ahrefs
Keyword rankings
Perhaps the most accessible and interesting metric to our clients and bosses is keyword rankings. They want to know how many keywords their domain ranks for, and how that compares to their competitors.
A broad understanding of keyword ownership within your space can tell you plenty about both the size of your search landscape, and how you measure up.
If you think of the keyword landscape as your market size, and keyword ownership as market share, you will have a stronger understanding of where you are now, and where you want to be in the future.
But, SEO tools are very limited in their abilities to accurately report these numbers. While sophisticated, these tools have to rely on scraping Google to generate data. And the quality of the data output depends largely on the power of the scraping tool and the size of its database. As you will soon see, the data varies enormously from tool to tool.
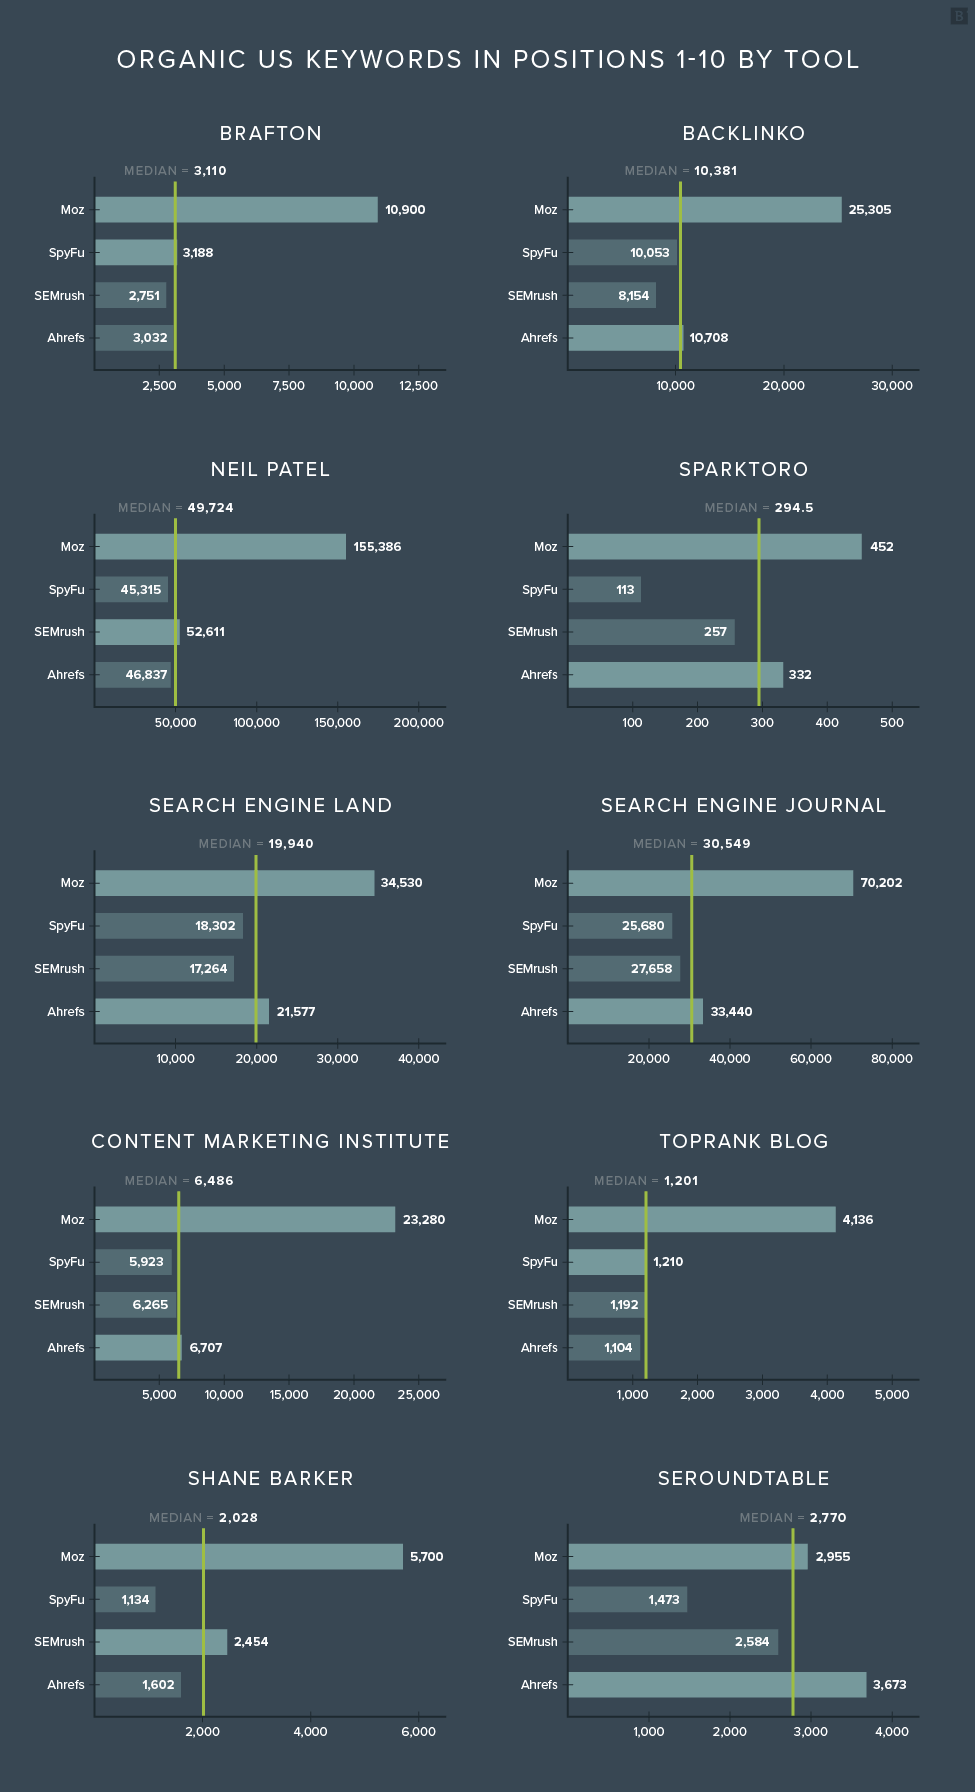
All data was collected in an identical fashion. I pulled the total number of keywords ranking 1-10 in U.S.-based searches from each of the tools: Moz, Ahrefs, SpyFu, Sistrix, and SEMrush. Unfortunately I had to leave Sistrix out of the final analysis as it only reported 11% of the median overall, thus distorting the field.
Here’s an example of some of the data:

As you can already see, there is a LOT of discrepancy in the data, and it’s only going to get worse. Using the same technique of comparing each tool’s reporting to the median, I found the following:
The first thing that jumps out at you is probably: “What’s going on with Moz?” While Moz also reported a larger number of linking root domains than its competitors in the previous study, the numbers weren’t disproportionately large enough to break the model. Here is the overall reporting against the median:

In this case, Moz broke the model. My initial concern was that Moz was reporting worldwide keyword rankings, rather than U.S. keyword rankings. I voiced this concern with their team, to which they replied:

To be sure, I asked them to escalate to their engineers for confirmation. They replied:

According to the Moz team, these numbers are indeed on the level.
So what does this information tell us?
On average, Moz reported 2.5 times more keywords than the median. Ahrefs landed squarely at the median, with SEMrush closely trailing. SpyFu rounds out the group, coming in at 81% of median, while Sistrix was omitted, reporting only 11% of the median.
Again, while the sample size is indeed small, we do have some clear markers:
- Moz beat the median 100% of the time.
- Sistrix beat the median 0% of the time.
- Ahrefs and SEMrush showed a high level of consistency near the median.
If the experts at Moz are correct, then we can make a generalized statement that their tool will likely report a larger number of keywords per domain. We can also say it’s likely (not guaranteed) that Ahrefs and SEMrush will report similar and consistent results. It’s also likely that SpyFu will generate fewer results, and Sistrix will populate the fewest.
But how close are these numbers to the truth?
It’s tough to say, because we are trying to take a snapshot of a moving target. Keywords constantly flow in and out of the top 10 results. And on any given day, one tool can show a keyword ranking in position 9, while another can simultaneously put the keyword at position 11.
For this reason, this particular portion of the study was highly susceptible to inaccuracies, both due to the nature of trying to pin down a moving target, and the variability of each tool’s scraping capabilities.
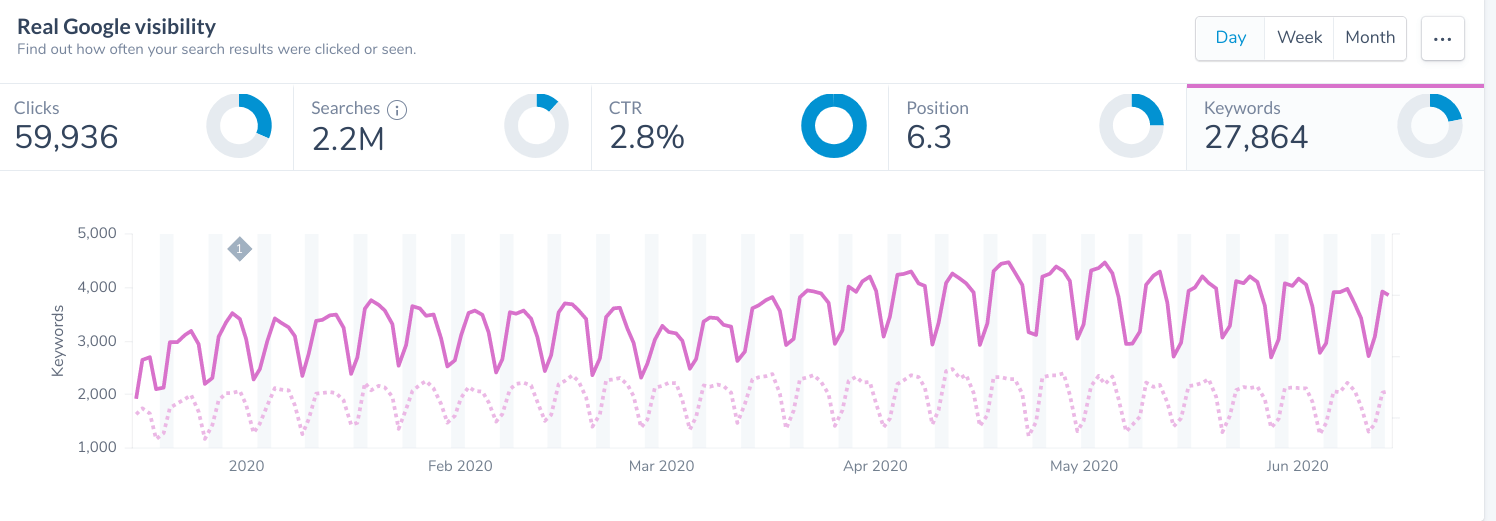
Fortunately, with a big thanks to Marcus Tandler and the people at Ryte, we can see the actual number of keywords our site ranks for. Ryte is a sophisticated tool that integrates all of Google Search Console data and manipulates it in ways that give you true data rather than scraped data.
Over the month of June, Ryte shows that Brafton actually ranked for 16,567 keywords in positions 1-10 in the U.S.

The median reported metric was only 18.3% of the true number for one month.

And that’s only one month’s worth of data.
SEO tools accumulate your keyword rankings over months and years. Meaning, one of your tools may show that you currently rank for a keyword that nobody has searched for in years, nor generated impressions.
This is the reason a keyword tool we’ve used for years might report that we still rank for things that nobody searches anymore, like “Keyword research techniques 2017.”
If we spread out the timespan to include the first six months of 2020, we generated impressions for 27,864 keywords.
So in any given month, despite any tool’s best efforts, you may only be seeing a fraction of the true number.
Does this mean SEO tools aren’t doing a good job? Not at all!
As a matter of fact, these tools certainly prioritize meaningful, higher-volume keywords in their database over longer-tail terms with significantly lower search volume. But it also means that we need to appreciate their limitations and understand that the numbers we are seeing are not perfectly accurate.
Another reminder that we should use SEO tools for macro analysis that will give us broad stroke insights into trends and competitive benchmarking.
Winner: Moz
Bonus: Estimated traffic
A few SEO tools try to estimate the amount of monthly organic visitors a domain drives. Similar to the previous study, estimating organic search traffic can be a useful competitor benchmarking practice, and is an incredibly accessible metric for clients.
Unfortunately for this study, there aren’t many tools out there that do this. And fewer still that do it accurately.
Similar to the previous studies, I collected data from various tools and mapped their output against the median data point. I pulled the estimated U.S. organic visitors for the month of June 2020.
Unfortunately we had to omit data from SpyFu this time, as it wildly overestimated search traffic to each domain by an average of 3,242% higher. I also had to omit TopRank from the analysis, as not all tools were able to populate data for this domain.
Here’s an example of some of the data:
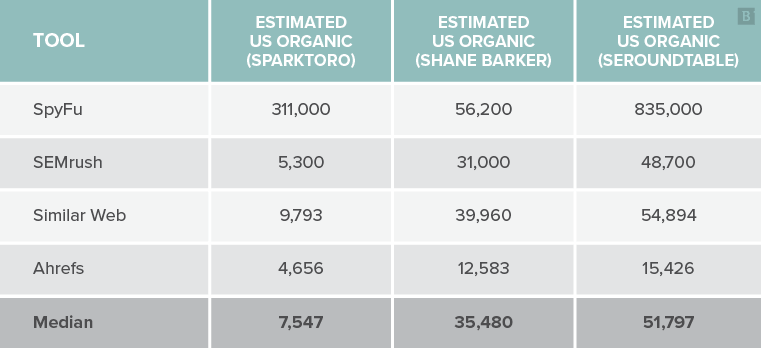
You can see right off the bat why I had to omit SpyFu from the analysis. With all respect to the folks at SpyFu, this particular metric needs a second look!
For the remaining three tools, here is what the data looked like for each domain:

And here are the average reported numbers versus the median, by tool:

As opposed to the previous two studies where you could argue more data is generally better, in this instance that might not be the case (as you can see with the SpyFu numbers).
In this instance, accuracy is key. On average, Ahrefs reported much lower estimated traffic figures than both SimilarWeb and SEMrush.
But we really have no idea if any of these numbers are good or bad without context. We need actual (accurate) numbers to compare them to.
Fortunately, I was able to pull actual traffic numbers from SparkToro.com, ShaneBarker.com, and Brafton.com. Big thanks to Rand Fishkin and Shane for helping make this happen.
Here are the estimated figures vs. the actual numbers:

Let’s take a look at this visually, starting with Brafton. To read the charts below, consider the 0% line as the actual traffic, and any number over 0% as an overestimate by the tool, and anything under as an underestimate.

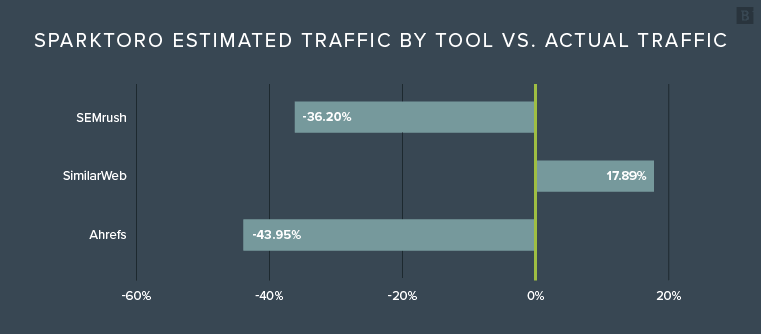

Visually, it seems that SimilarWeb came close to the actual number in each of the three instances. Ahrefs seems to consistently underestimate, while SEMrush will wildly overestimate AND underestimate.
To clean these numbers up, we can take the overall average accuracy of each tool by averaging the percentage overestimates and underestimates relative to the actual number. The overall accuracy by tool is as follows:

Major caveat here: We need way more data. While it’s very interesting to see how each tool compares versus the actual numbers, we don’t have nearly enough data to make any conclusions. At a glance, it SEEMS that SimilarWeb estimates fairly accurately, coming in at 91.7% average accuracy.
So what does this tell us?
SimilarWeb MAY report slightly more accurate traffic estimates. Ahrefs MAY underestimate traffic in some cases. As of now, this analysis should be taken with a big grain of salt, and with a callout to the other six sites for assistance on this study.
For now, let’s just say these tools show significant variation, and until further notice, we should continue calling this metric what it is: Estimated traffic.
Winner: SimilarWeb in preliminary heat
Summary
Again, with caveats all around, the winners of this limited-size test are as follows:
The intention of this report was not to declare all SEO tools as inaccurate and unworthy of investment. Nor was the intention to sing the praises of the top performing tools’ capabilities. Rather, my aim was to demonstrate the differences between the tools in order that you can have more context when using their numbers for reporting.
For example, if you’re reporting on the number of root domains to your site, it’s important to know that Ubersuggest may report a significantly lower number than other tools. With that in mind, you may want to caveat your data. You should also take caution to not mix tools when using competitive benchmarking.
You should also tell your clients that the metrics reported in these tools are not to be taken for gospel. They should be used for general trend analysis and competitor benchmarking purposes. Used correctly, each of these tools can be massively insightful.
Used incorrectly, they can be massively misleading.
Contributing authors are invited to create content for Search Engine Land and are chosen for their expertise and contribution to the search community. Our contributors work under the oversight of the editorial staff and contributions are checked for quality and relevance to our readers. The opinions they express are their own.
Related stories
New on Search Engine Land
About the author