Track Quality Score daily with this advanced Adwords script
This script will help you measure the impact of your optimizations on a daily basis.
Quality Score is one of the most important metrics in Google Ads as it has a direct impact on how much you pay per click.
Data from Wordstream would suggest that simply increasing your Quality Score from 5 to 7 would result in a decrease in CPC of 28.6%.
Despite its importance, it’s been historically difficult to track.
Although Google introduced historical Quality Score metrics back in 2017, It’s still not possible to see day by day fluctuations in Quality Score without using an external API based tool.
Martin Roettgerding wrote a great script back in 2006 that allows advertisers to track Quality Score. Google has since released an improved Quality Score report allowing advertisers to see ad relevance, expected CTR and landing page experience which we’ve wanted to track.
So the developers who work at Clicteq, my employer, built this script to help you track Quality Score daily, so you can measure the impact of your optimizations.
It further builds on Martin Roettgerding’s script allowing you to track the daily performance of the individual factors that make up the overall Quality Score, including expected CTR, ad relevance and landing page experience.
How the script works
When the script runs it creates two tabs within the Google Sheet.
The dashboard contains eight graphs that quickly allow you to see how your Quality Score is performing.
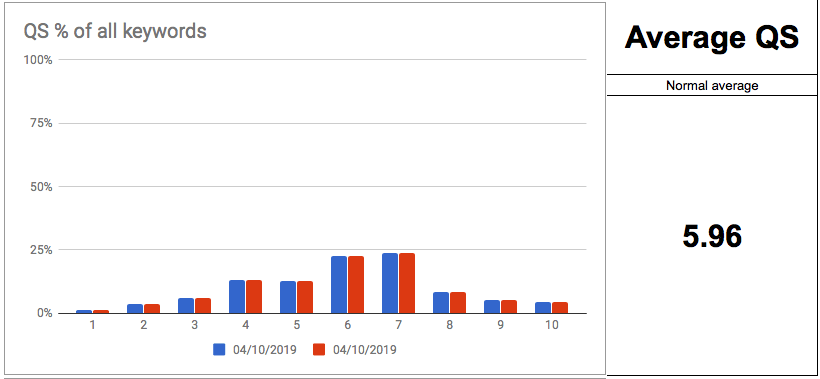
The first chart shows the percentage of keywords that are in each Quality Score band (1 to 10) as shown below. It also records Quality Scores on the first day that the script was run in blue so that you can compare how your Quality Score has changed.
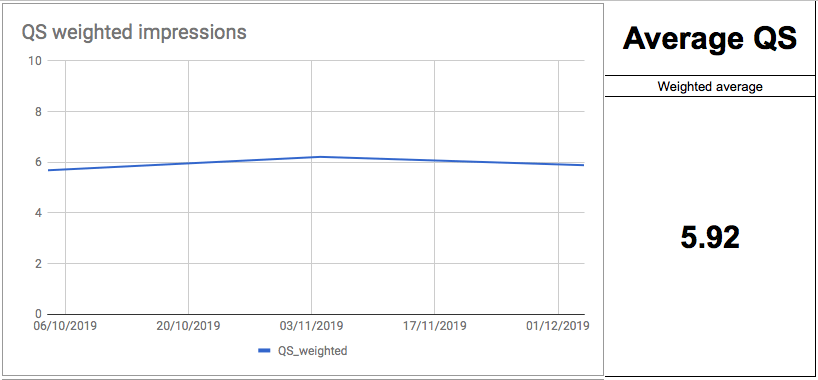
The second chart plots impression-weighted Quality Score daily allowing you to see how it fluctuates.
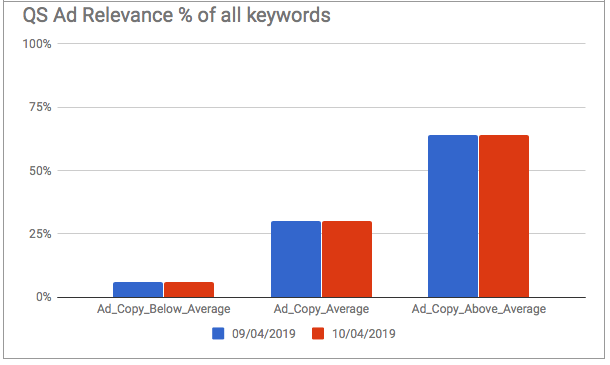
The three charts on the left side then show what percentage of keywords are either above average, average or below average.
With a separate graph for each of the three parts that make up Quality Score (Ad relevance, landing page experience and expected CTR) as shown below.
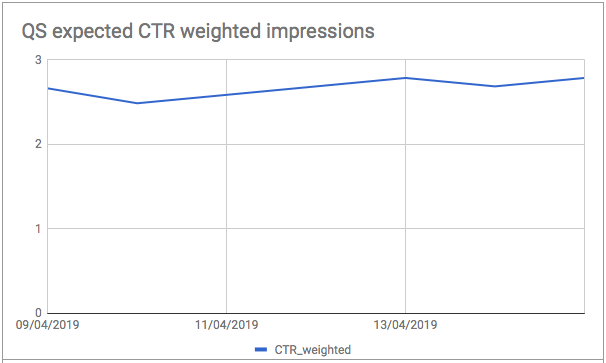
There are a further three charts on the right-hand side the plot impression-weighted Quality Score expected CTR, Ad relevance and landing page experience on a scale of one to three.
A score of three would indicate that 100% of your impressions would have come from keywords that have above average expected CTR.
On the opposite end of the spectrum, a score of one would mean that 100% of your impressions would have come from keywords that have an expected CTR below average.
The data sheet creates a new data point each day and reports the following metrics:
- Percentage of keywords that have above average, average or below average expected CTR, landing page experience and ad relevance.
- Impressions weighted score between 1 to 3 for expected CTR, landing page experience and ad relevance.
- Percentage of keywords which fall into each Quality Score 1-10.
- Impression weighted Quality Score across all of the account.
- Account average Quality Score by the amount of keywords in each score.
Setting up the script
If you’ve never used Google Ads Script before and the code below looks scary, don’t panic. You can use a short guide to help you copy and paste the code below into the right place within Google Ads.
Before you run the script, however there are a couple of things that you need to change.
- Go to Google Sheets, create a new document and copy the URL.
- Paste the URL of the sheet into line 17 of the script. When the script runs, it will output the data and charts to the Google Sheet you just set up.
- Schedule the script to run daily – this can be done within the main Google Ads script dashboard.
Now the script will run each day and update the sheet, allowing you to track top-level Quality Score data, as well as a breakdown of the specific metrics that constitute Quality Score on a day by day basis.
Contributing authors are invited to create content for Search Engine Land and are chosen for their expertise and contribution to the search community. Our contributors work under the oversight of the editorial staff and contributions are checked for quality and relevance to our readers. The opinions they express are their own.
Related stories
New on Search Engine Land
About the author