How Travel Advertisers Should Actually Be Using Search Marketing Benchmarks
Contributor Lori Weiman of The Search Monitor shares data to help travel and hospitality marketers gauge their success.

Benchmarks have always been a hot topic in the world of PPC measurement. After all, it’s often left up to the marketer to choose the benchmarks that will be used to evaluate their performance. In some respects, it’s like letting an Olympic athlete decide how they will be scored after they’re done competing.
Using data from The Search Monitor (full disclosure: my employer), this article will show travel advertisers which PPC benchmarks they should use to effectively evaluate and improve their performance.
To help with this discussion, I chose five essential PPC metrics to look at: number of advertisers, ad share, ad rank, click-through rate and cost-per-click.
First, let’s discuss what makes the most effective PPC benchmark.
Benchmarking Against Yourself
Who do you currently use to benchmark your search marketing performance? If you say, “Myself, of course,” you’re definitely not alone.
Benchmarking yourself against yourself (i.e., “present you” versus “historical you”) can definitely be helpful. It can lead to incremental improvements in search marketing and is an easy and fast method of evaluating progress.
However, internal benchmarks are lousy at revealing your true potential. Without a broader industry perspective — including specific competitors and industry leaders — you are essentially operating in a vacuum. It’s similar to a golfer trying to win a tournament by training by himself, without knowing how other golfers will likely perform.
I see this internal benchmark phenomenon all too often among travel advertisers. When I ask new travel clients how they benchmark a recent quarter’s performance, they typically respond that they compare it with the same quarter a year earlier and measure any percentage change.
I hear a similar response when I ask about benchmarks used to set future performance goals. I hear that they will simply target, say, a 10% improvement over their company’s most recent time period.
While these benchmarks are common and might even generate a respectable single-digit salary increase at year-end, they have their faults. If a key competitor has been improving their search performance by 20% or more, for example, the 10% company is actually losing ground. Plus, a company can get complacent with its tactics if it knows it only needs to slightly outperform an internal benchmark to achieve success.
A benchmark composed of one’s peers, however, shows search marketers a broader picture of what’s possible in the world of search. It can confirm that a company is truly performing at the peak of their industry. This is crucial information for any CEO wishing to achieve above-average growth in their industry.
So why don’t more search marketers use external benchmarks? The short answer is that it’s challenging and time-consuming to find benchmarks that are relevant to their business and timely enough to be helpful. As a result, many companies choose to outsource this part of their business to a third party that can gather detailed data across multiple industries, and do it on a frequent basis.
Options For External Benchmarks
Let’s look at the three most common types of external benchmarks:
- Industry-Level Benchmarks. These can be broad (ex: Travel), a second level (ex: Lodging), or highly detailed (ex: Florida condos).
- Industry Leader Benchmarks. This group is a subset from above. It is used by companies wanting to compare themselves with just the best performers in their industry, not the full range of companies.
- Competitor Benchmarks. This usually includes 5-10 similar companies currently marketing to your customers but can also be a group of “stretch” competitors that you would like to compete with in the future.
Which one should you use? A lot depends on which one or ones are most relevant to your business, its growth strategy, and your industry.
For example, some of our clients create customized benchmarks based on other company’s revenue, products, and years in business. Other clients choose to create benchmarks using companies with similar PPC behaviors, i.e., they have approximately the same monthly click and spend totals.
Another important note on benchmarks is that they are highly dynamic. A perfectly calibrated benchmark group might need re-calibration in one quarter’s time as new industry threats appear, for example.
With that preamble out of the way, let’s look at industry-level benchmarks across five key performance indicators for travel advertisers:
- Number of Competitors
- Ad Share
- Ad Rank
- Clickthrough Rate
- Cost Per Click
Travel Benchmarks For PPC Competition
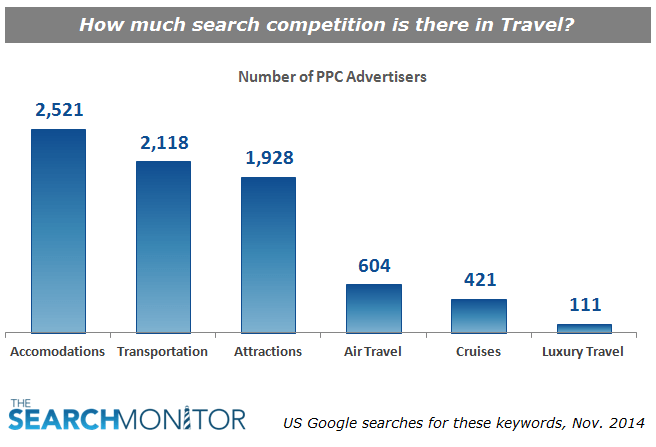
Why This Metric’s Important: The number of competitors shows the total number of advertisers bidding on the keywords in your industry. It’s one of the best measures of competitiveness for your keyword groups.
What We See: The chart shows the six main sub-verticals within Travel. As expected, most advertisers can be found in Accommodations, while Luxury Travel has the fewest. We also saw that the number of competitors was lowest in the Air Travel and Cruising verticals, where there tends to be fewer, larger players.
One vertical that caught our eye was Transportation, which surprised us with more than 2,000 advertisers — highly competitive. For reference, this category includes services such as car rental, parking, taxi, bus, and other transportation charters.
Travel Benchmarks For Ad Share
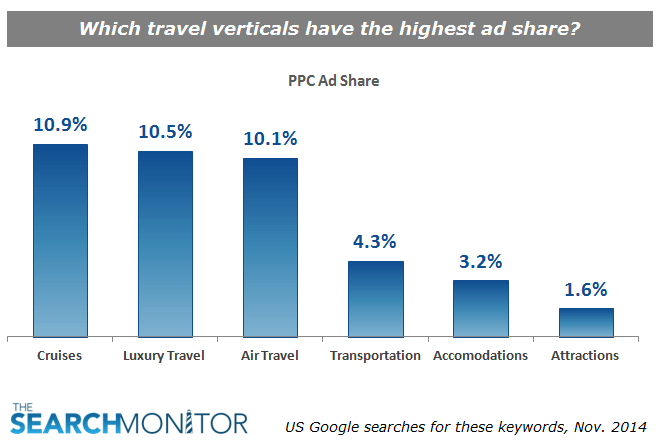
Why This Metric’s Important: Ad share is calculated as the percent of ad exposures across all keywords monitored, with a boost in score for better rank. It’s one of the first metrics to monitor since low share can help explain other data points such as low click totals.
What We See: The chart above shows that three of the six travel verticals — Cruises, Luxury Travel, and Air Travel — scored at least 10% for ad share. These verticals all have a higher-than-average price point for their products, so it makes sense that they would spending more to achieve higher ad share.
Conversely, advertisers in the Attractions and Destinations sub-vertical averaged a meager 1.6% ad share. How would an advertiser in the Attractions vertical use this data? If they were underperforming, this could be their new benchmark to beat for future campaigns.
Travel Benchmarks For Ad Rank
![]()
Why This Metric’s Important: Like it sounds, Ad Rank is the average rank seen during the time period monitored, in this case November 2014. This very simple metric helps advertisers understand their click and spend data, especially when an average rank falls below the industry benchmark.
What We See: The Attractions vertical won the battle for the best PPC rank, scoring an average of 2.9. We would expect to see a high clickthrough rate as a result of this ranking. The Cruises and Transportation verticals, meanwhile, showed up lowest on the page of the six verticals monitored, with an average position of 4.7.
Travel Benchmarks For Click-Through-Rate
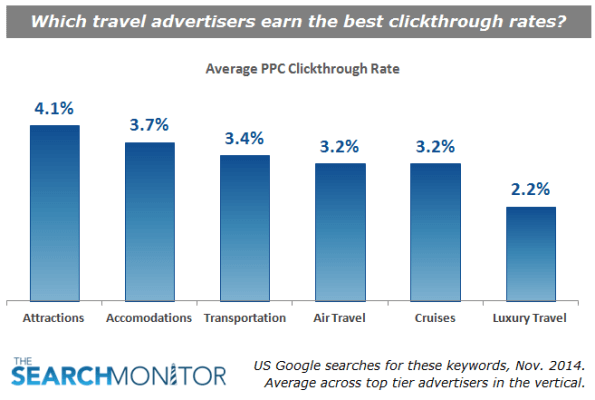
Why This Metric’s Important: For many companies, the clickthrough rate is all that matters at the end of the day. The Search Monitor is able to estimate the clicks received by any advertiser to a high degree of accuracy, and then calculates the CTR using the number of times the ad appeared.
What We See: As predicted from the Ad Rank chart above, the Attractions vertical is the CTR winner among the six travel verticals, receiving a 4.1% CTR. On the other end of the spectrum, we see that the Luxury Travel vertical received around half the clickthrough rate that Attractions received (2.2%). Why the disparity? There are, of course, many reasons, including factors like the time of year, ad copy, offers, and other supporting advertising.
Travel Benchmarks For Cost-Per-Click
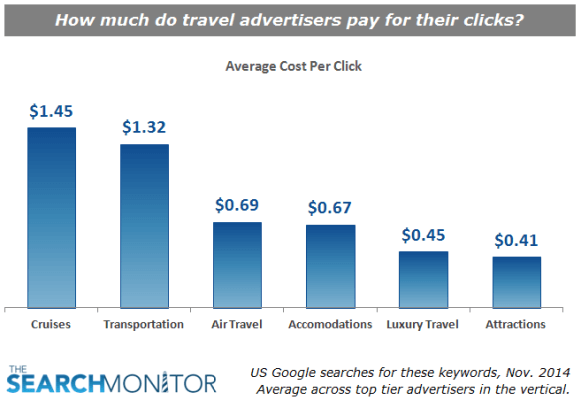
Why This Metric’s Important: The last important metric to benchmark is the cost-per-click (CPC), since there is a point at which more clicks can harm the bottom line. And similar to click data, most advertisers don’t realize that it’s possible to produce precise estimates of how much any advertiser spends on each of its clicks.
What We See: It’s no surprise that the Cruises vertical—with its higher price points–outspends the others for its clicks. CPCs are also often connected to the competitiveness of an industry, and here we see that highly competitive Transportation vertical has the second highest CPC. A surprise in this chart was how little the Luxury Travel vertical pays for its clicks ($0.45).
Using PPC Benchmark Data In Travel
Other than seeing how your PPC performance compared to others, how exactly should travel advertisers apply these benchmarks? Below are a few common ways I have seen from our clients:
- Trend Them. Look at each benchmark by month for at least a 12-month period to identify seasonality and learn when opportunities might arise
- Compare Them. Calculate several different versions of your benchmarks—i.e., industry, industry leader, and competitor—and see how they compare. You might want to create a custom version using all three
- Get Alerted. Set up automatic alerts for when any of these five metrics number dip below or increase above your benchmarks
- Identify Opportunities. Monitor your performance against your external benchmarks to identify opportunities to move into new keyword groups or temporarily shift budget away from others.
- Be Frequent. Keep your benchmarks updated often. They should be re-calculated monthly in order to keep up with major changes by competitors. Too often search marketers look at benchmarks just once, during budget planning, and are surprised one quarter later how far behind the competition they are.
Hopefully, the charts above have revealed the shortcomings of benchmarking yourself against yourself, and the wealth of knowledge that you can receive when incorporating a more relevant external benchmark.
Clearly, the best search marketing benchmarks are the ones that keep you on your toes and encourage you to keep improving your search marketing performance.
Contributing authors are invited to create content for Search Engine Land and are chosen for their expertise and contribution to the search community. Our contributors work under the oversight of the editorial staff and contributions are checked for quality and relevance to our readers. The opinions they express are their own.
Related stories
New on Search Engine Land
About the author