Quantifying The Mobile Revolution: Mobile Advertising Progress In 2014
What's in store for paid search marketers as mobile continues its path to digital dominance? Columnist Matt Ackley tackles this question with insights gleaned from a forthcoming Marin research report.

We often talk about the “mobile revolution,” but what does that mean exactly? How is the shift in consumer behavior to mobile devices affecting the decisions marketers are making? Is it changing the marketing mix? And how are mobile ads performing in comparison to its desktop counterparts?
At Marin, we wanted to get to the bottom of these questions (and more), so we took a look across leading brands and advertisers that manage more than $6 billion in annualized search, social, and display spend on our platform. Based on our analysis of this data, we created a report on the mobile trends and overall performance of mobile ads from 2014. We also used our findings to forecast the state of mobile advertising for 2015.
Our goal for the report is to help marketers understand the explosive growth in mobile advertising, and to inform them in developing effective benchmarks and strategies for success. We’ll be releasing the full report later this month, but in this post, I’ll provide a sneak preview of some of the key findings.
Mobile’s Increasingly Omnipresent Footprint
Consumer adoption of mobile is a fait accompli at this point. Browsing behaviors have sufficiently shifted from desktop to mobile. Today, consumers are spending most of their digital viewing time on mobile devices, and advertisers have responded by diverting advertising budget towards those devices.
Mobile share of spend — aggregated across search, social, and display — has been on a steady increase and is poised to take over as the primary channel for reaching customers in 2015. Globally, mobile ad spend has been growing at a striking pace, with $40.2 billion spent in 2014 and a projected $64.25 billion to be spent in 2015.
Social Share Of Spend Is Already Mobile First
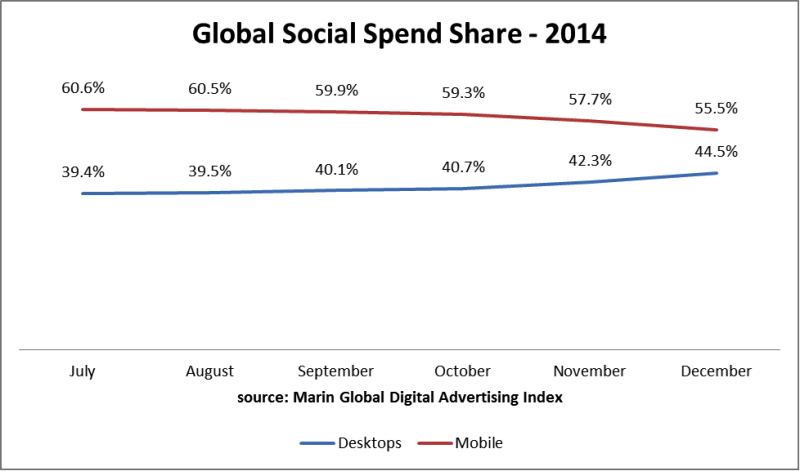
Social media consumption is particularly mobile-focused, so naturally marketers have been quite progressive about shifting social ad dollars to mobile devices. Over 55% of social ad spending was on mobile ads, which mirrored the 62% of social clicks driven through smartphones and tablets.
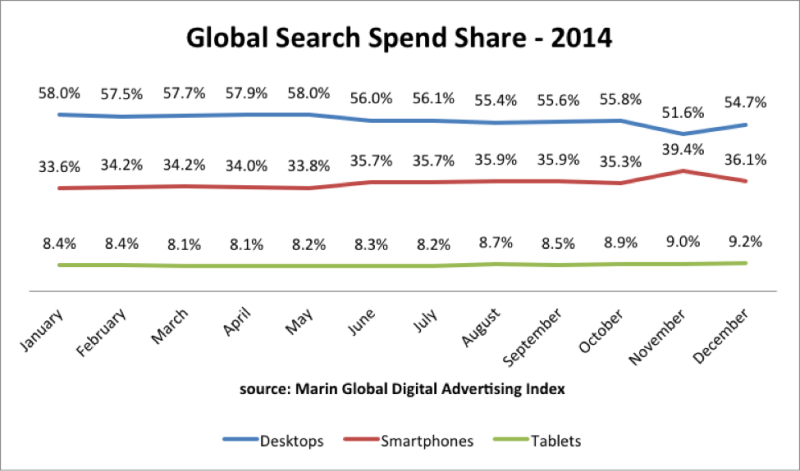
Global search spend showed a steady shift from desktop towards mobile. Mobile search spend share grew 8% over the year, peaking in November as retailers revved up their mobile focus for the holidays.
We expect the majority of search spend to shift from desktop to mobile devices by Q3 2015, and the 2015 holiday shopping season will undoubtedly result in another big win for mobile search.
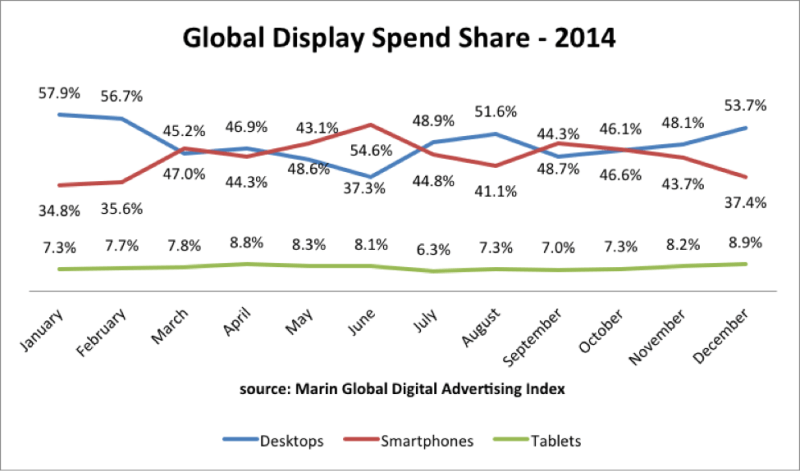
Whereas search spend by device was relatively steady, we found that display spend behavior fluctuated dramatically during 2014. Mobile spend actually eclipsed desktop spend at several points throughout the year.
Despite the month-to-month volatility, overall display advertising budgets have been trending towards mobile devices, with particular emphasis on smartphones. By mid-2015, we predict that the ebb and flow between desktop and mobile will subside, and mobile will take over as the primary device for attracting display advertising dollars.
The Unique Click-Through Behavior Of Mobile Search By Ad Position
Advertisers have responded to changes in consumer behavior by altering their marketing mix and increasing spend on mobile. But are they just throwing more money at mobile devices? Or are they finding the same level of effectiveness with their mobile campaigns?
One way we tried to determine this was by looking at mobile click-through rates (CTR) and how they compared to those for desktop ads.
Based on CTR, mobile ads appears to be very successful. Across channels, smartphones have shown higher click-through rates than desktops, while click-through rates on tablet devices rival those of desktop.
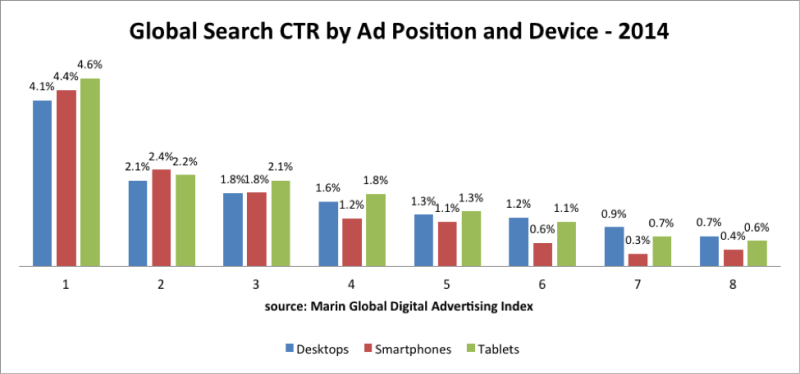
However, average CTR only tells part of the story. We also investigated click-through rate by ad-position, which showed that the position of the mobile search ads play a large part in why smartphone CTR is so much higher than desktop and tablet.
If we drill down and look at search click-through rate by ad position, it is apparent that the difference between devices isn’t as pronounced as it initially looked. Tablets actually have the highest CTR for the first search ad position, and smartphone click-through rates drop sharply starting at position four.
This drop-off is due to how smartphones deliver search ads — there are less search ads per page compared to desktop and tablet SERPs. Whereas lower ad positions can be just as cost-effective as higher ad positions on desktop, the limited real estate for ads on mobile means advertisers should consider a more aggressive mobile bidding strategy to maximize performance.
Desktops Still Rule Conversions — But The Attribution Is All Wrong
Before we dive into mobile conversions, I’ll caveat this section by mentioning that determining mobile performance simply by measuring click-through conversions is foolhardy. Although it may change one day, consumers today aren’t nearly as likely to select a product, log in, enter their payment information, and check out from their smartphones as they are from their desktops.
Thus, getting a more accurate picture of mobile performance requires a solid view-through conversion model at worst, and an algorithmic attribution solution at best. With that said, click-through conversions do at least give a picture of how trends are moving.
Across all channels, desktops remained the highest-converting device. Smartphones are still lagging behind for conversions, which is reflected in its relatively lower cost-per-click.
As I mentioned above, what the conversion rate fails to take into account is all the mobile-initiated conversions that occur in different environments: in-store purchases driven by mobile, mobile click-to-call or click-for-directions, or later conversions on a desktop device.
For example, Deloitte released data in April 2014 which found that mobile device usage helped account for roughly $593 billion of US in-store retail sales in 2013, or almost 20% of all brick-and-mortar sales.
None of this value gets attributed to mobile devices based on click-through conversions. The difficulty in tracking these types of conversions hurts the recorded conversion rate, but the conversion rate with all these disparate factors included would likely be significantly higher.
In a search-centric world, measuring and attributing performance was pretty easy. While not perfect, you could rely on click-through rates and click-through conversions as one source of truth. However, as social and display ad spending increases, and as mobile devices introduce new measurement and targeting challenges, this picture of performance will become increasingly complicated and interconnected.
Contributing authors are invited to create content for Search Engine Land and are chosen for their expertise and contribution to the search community. Our contributors work under the oversight of the editorial staff and contributions are checked for quality and relevance to our readers. The opinions they express are their own.
Related stories


