Brand reputation and the impact of Google SERP selections
How Google treats company navigational brand searches and the impact they can have on consumer perceptions.
This deep dive started with a thread a few weeks ago about Google’s selection of People Also Ask (PAA) results and the potential impact it has on brands.
In this article, I will share an analysis looking into the sentiment expressed in PAA searches across companies in the Fortune 500 list from 2019. In our analysis, we use ranking data from Nozzle which makes for easy, daily extraction of PAA results, Baidu’s open-source sentiment Analysis system, Senta, and the Google NLP Language API. We will learn:
- There are definite winners and losers in content Google highlights about brands.
- A handful of domains own the lion’s share of visibility in Fortune 500 brand search results.
- Some companies have very consistent results, while others vary wildly.
- Google really likes to share with users if a company is any good.
- Top websites usually generate “is company legit?” results.
- The pandemic has strongly affected some PAA results.
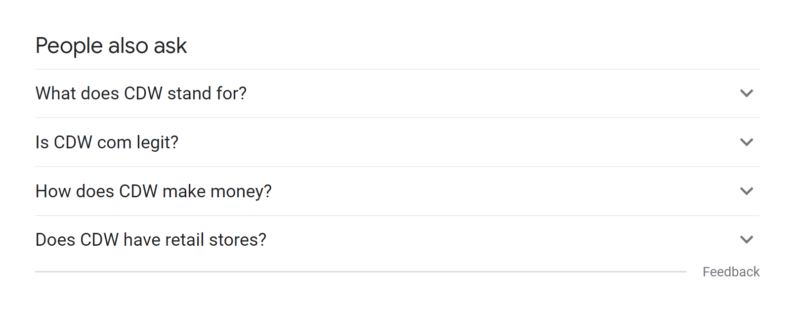
But first, for those unfamiliar with PAA results, this is what they look like:
RELATED: ‘People Also Ask’ boxes: Tips for ranking, optimizing and tracking
For many companies, PAA results have prominent placement in Google and Bing search results for many or most of their brand searches. In the image above, this is a result for the search “CDW.” The term “CDW” has a search volume of 135,000 US searches per month, meaning that a large share of those searches may see “Is CDW.com legit?” every time they want to go to CDW’s website.
This is something that some users may want to know. Take a look at this Reddit post from two years ago.
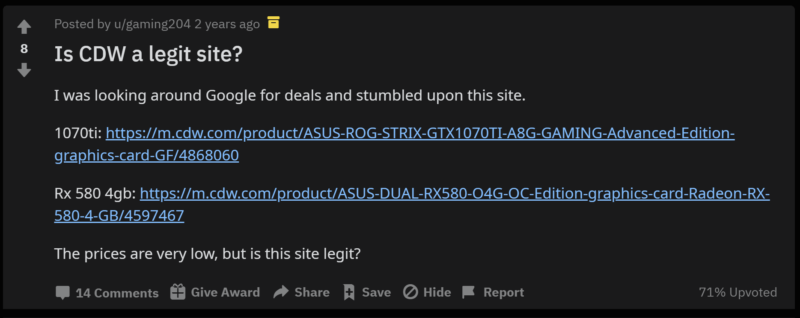
So the question is, is this a good thing or a bad thing? I see the benefit for users who do not know that CDW has been a trusted B2B technology retailer since 1984. But I also see the issue from CDW’s side in that this potentially is a thin-sliced doubt inserted into their customer’s subconscious, repeatedly, 135,000 times per month. It is also fair to point out that this question is well answered for people that have it.

Processing the data
Now that we’re all caught up on PAAs and how they may influence brand perception, I’ll walk you through some of the data collection and sentiment model information. Some people like this stuff and it prepares them to understand the data. If you just want to see the data, feel free to skip ahead.
In order to start the process of understanding company PAA results, we needed to first obtain a list of companies. This Github repo has collected Fortune 500 company lists from 1955 onward and had 2019 in an easy-to-parse CSV format. We loaded the company names into Nozzle (a rank tracking tool we like for its granularity of information) to begin daily data collection of US Google results. Nozzle dumps their data to BigQuery which makes it easy to process into a format readable by Google Data Studio.
After tracking in Nozzle for a few days we were able to extract all of the PAA results that showed for the company name searches in Google to a CSV for further processing.
We used the Senta open-source project from Baidu to add a sentiment score to the PAA questions. The Senta SKEP models are interesting because they effectively train the language model specifically for the sentiment analysis task by utilizing the masking and replacement of tokens in BERT-based models to focus specifically on tokens that impart sentiment information and/or aspect-sentiment pairs. (paper)
After some experimentation, we decided that the aspect-based model tasks performed better than the sentence classification tasks. We used the company name as the aspect. Essentially, the aspect is the focus of the sentiment. In traditional aspect-based sentiment analysis, the aspect is generally a component of a product or service that is the recipient of the sentiment (e.g., My Macbook’s screen is too blurry). Since we also wanted to compare with Google’s NLP API data, we also converted the model’s output to be in the range of -1 to 1. By default, it is either labeled “positive” or “negative.”
We then pulled a comparison score by using Google’s Language API to process the PAA questions. Google has the ability to request entity-based sentiment, but we decided against using it as the correct labeling of the companies as entities seemed hit or miss. Also, we omitted magnitude in the output as there was not an equivalent in our Senta output. Magnitude is the overall strength of the sentiment.
We wanted to share our code so others can reproduce and explore it on their own. We created an annotated Google Colab notebook that will install Senta, download our dataset, and assign a sentiment score to each row. We also included code to access Google Language API sentiment, but that will require API access and uploading of a service account JSON file.
Finally, we set up rank tracking in Nozzle for all 500 companies to monitor the websites that rank for “is legit?” and “is legal?” queries to see if we could identify whether certain domains were driving this content. In addition, we pulled revenue change data from this year’s Fortune 500 companies to use as another layer to compare sentiment impact against.
Analyzing the data
Now we get to the more interesting part of the analysis. We developed a Data Studio dashboard to give readers the opportunity to explore our collected data. In the following paragraphs, we will outline what was interesting to us but are more than open to insights shared by others here, or on Twitter.
The dashboard is broken into ten different views with the last two pages showing the raw data. Each view poses a question that the view attempts to answer in data.
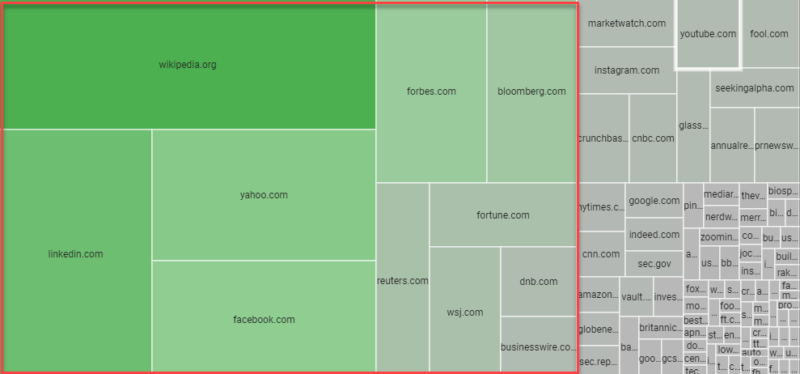
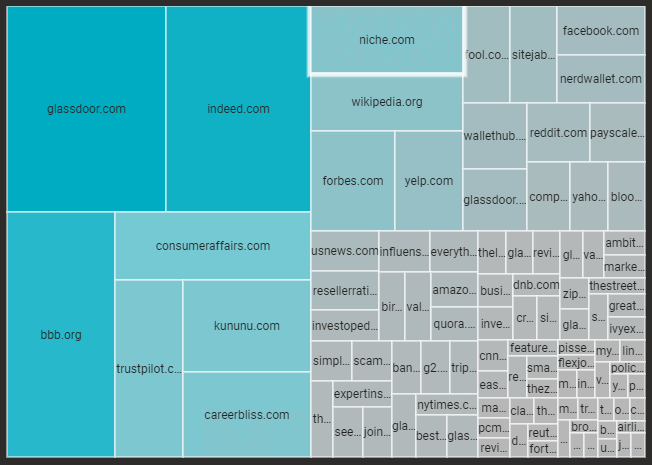
Domain share of voice. It is striking to see, but in the first view, we see that a few domains own the lion’s share of top-10 visibility across all 500 company brand searches. Wikipedia is present in 97.4% of all search results. Linkedin is a distant, yet impressive second at 75%.
Company PAA changes over time. In this view, we look at how PAA results change daily. This dataset started collecting data on December 8, 2020, so this chart will become more interesting as we progress into 2021. Here are a couple of my favorite companies.
Just as you would expect from a financial services company, at Morgan Stanley, slow and steady wins the race. Since December 8, the same four results have been displayed every day.

We can compare that against Microsoft, one of our most diverse PAAs with almost daily changes to the mix of PAAs displayed.

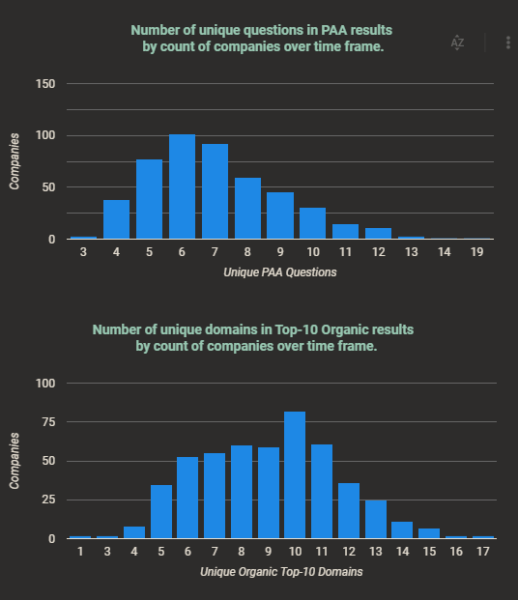
The median number of unique PAA results per company was seven over the nearly two weeks we have been collecting data. The median number of unique top-10 domains was exactly 10 over the same period. The chart below shows the distribution of unique results across all companies.
Centerpoint Energy and FedEx are the brand voice heroes here with their main brand search completely answered with their own content from one domain.
PAA themes for companies. This was one of the most interesting parts for me. We reviewed the PAA questions for the most commonly used parts of words to create a view that could tell us what people care about in regard to companies.
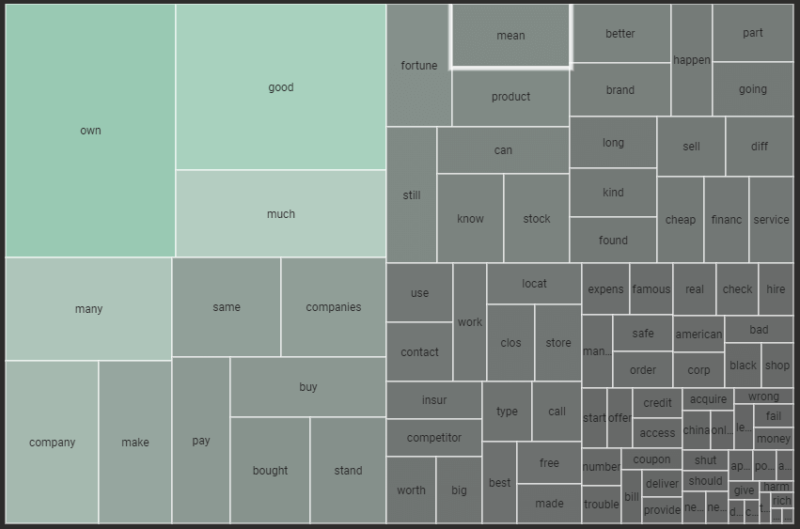
In nearly half the companies, Google infers that there is interest in who owns the company. Google also wants to surface information about whether the company is “good” for 37% of companies.
The saddest cohorts were the “going” and “clos” (“clos” is used here to represent words like “close,” “closed,” and “closing”) groups which seemed to answer the questions engendered by the pandemic about the solvency of popular companies.

Walmart posted a 123% (profit) growth in 2020, yet one of its consistent top questions is, “is walmart really shutting down?” Walmart has closed stores in recent years but many were the smaller format Express stores. Walmart is definitely not “shutting down.”
Looking at the PAA results with the lens of the online vs. brick and mortar companies, we see that comparing Amazon to Walmart, there is a clear benefit to the support of one over the other.
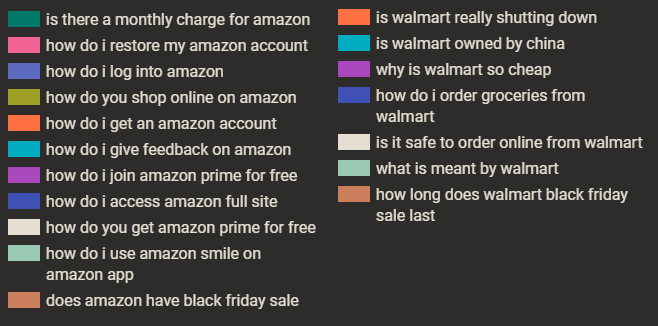
Obviously, the line between online and brick and mortar is not as clear since Walmart sells online and Amazon now has physical stores, but this does show how the selection of questions can create real, tangible goodwill benefit for competitors.
One other note, I started looking into this after seeing “Is legit?” on several company searches. In fact, in the PAA results collected across all 500 companies, there were only eight results questioning the company’s legitimacy of legality:
- is bold precious metals legit
- is aes legitimate
- is brighthouse financial legitimate
- is cdw com legit
- is footlocker a legit site
- is hd supply solutions legit
- is live nation legitimate
- is new york life insurance legit
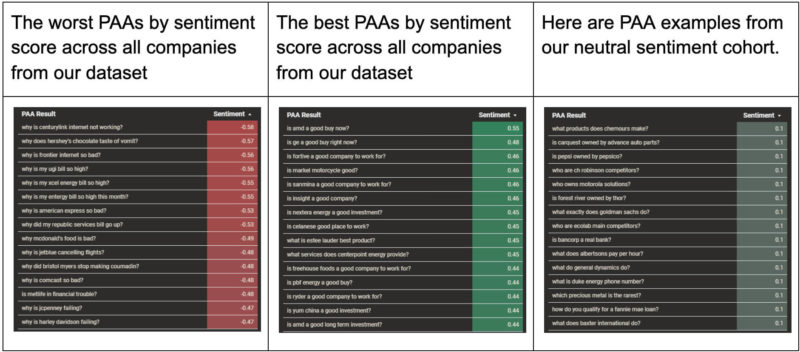
However, I discovered much worse. How would you like to be the brand manager at these companies with PAA questions in the “bad” cohort?
The next view, the PAA Question Exploration, was just a bit of fun. Since we had categorized the PAA results by theme and by question type, we built a tool that allows you to build out question phrases to get to specific company questions. In the image below, by clicking (1), you are automatically prompted with the next potential refinement options to click (2). You can then click (3) to see that company’s question that fits the pattern you chose.
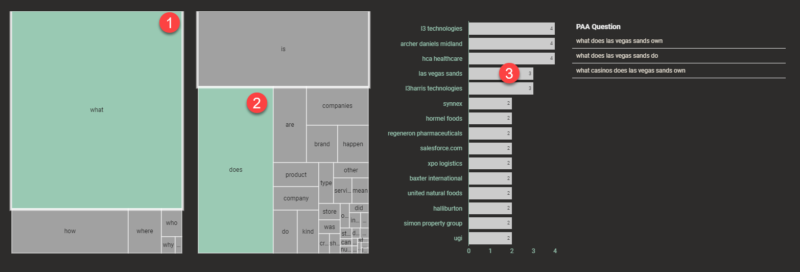
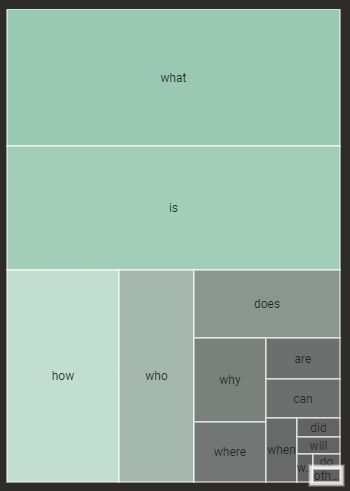
Speaking of questions and a bit of fun, leading the pack of the five Ws, “what” is the close winner with representation in nearly 29% of all PAAs collected. “Is,” the love child, comes in a close second, followed by “how” and “who.”
Company sentiment. Earlier we mentioned the Senta models from Baidu Research in the section covering how we scored sentiment. In this view, we took an average of the two best performing Senta models and Google’s NLP API sentiment to give the most balanced score since we liked some aspects of each model’s results. You can select a specific model in this view, but the default is the averaged view and the one we will use here.
These results from Pfizer show that Google understands the importance of highlighting questions that are important today.

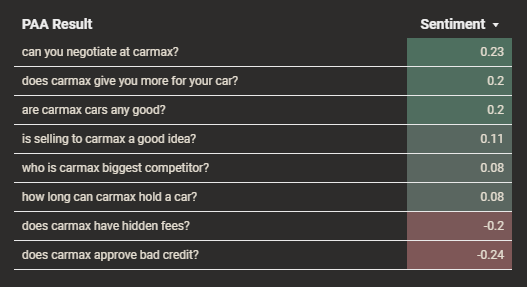
Out of all the companies in the sentiment view, I think Carmax was my favorite in terms of the balance of questions and helpfulness of results.
We took the revenue change numbers from this year’s Fortune 500 companies to see if there were any relationship between a company’s sentiment and its economic performance. While the cause of the chart below is debatable, it is still interesting that companies with more average negative sentiment tended to show weaker revenue growth.
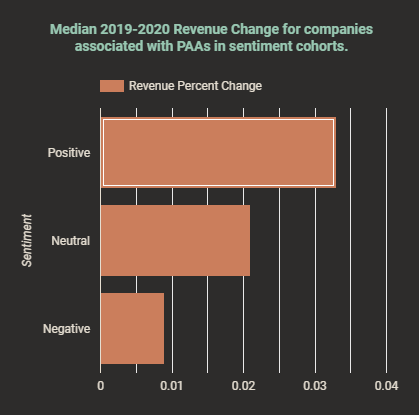
2020 was a painful year, and this is probably related to all the questions in results about company financial solvency, but if Google is a reflection of consumer questions and sentiment, maybe the results are just reinforcing that.
The legitimacy question. The final view in our dashboard covers domains that are targeting “Is <company> legit?” queries. We are tracking 1,000 searches: 500 “Is <company> legit” and 500 “Is <company> legal” queries. Of these 1,000 searches, Wikipedia has a presence in the top 10 results of almost exactly half, and almost exclusively “legal” searches.
Of the “legit” queries, the results are predominantly owned by business review sites and career review sites. The career prominence seems misaligned with a focus on letting potential customers know whether the company is a real company. Perhaps this is a hint that this is a popular intent for job seekers, although I can’t imagine a potential employee searching “is best buy legit?”
Looking specifically at domains targeting the “legit” and “legal” queries, meaning those words appear in the slug of the URL, we can see a couple of interesting takeaways.
There seems to be a habit of the specific legitimacy questions to be covered on forums like Reddit. In many of the cases, the result is relevant to the query, but not the intent of the search. For example, in an Nvidia forum, the user asks whether a promotion supposedly run by Nvidia is legit.

Many of the “legal” questions are directed to a site’s own legal policy page. I guess that is a good result?
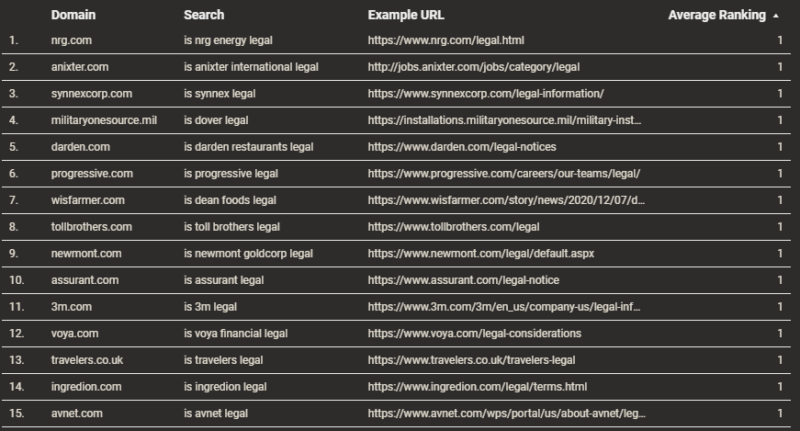
Finally, there was a site in our data pointed out to me by Daniel Pati, SEO Lead at Cartridge Save, that is apparently “going after” these “legit” searches by targeting various company questions. I won’t name the company, but you can do the search if you like.

If you are going to list questions like they were asked by actual users, then you probably want to vary them a bit. I think we counted over 300 of these pages, all with the same title, except for the company name.
Takeaways
I hope you enjoyed reading this as much as I enjoyed putting it together. I would like to thank Derek Perkins, Patrick Stox, and others at Locomotive for reviewing and critiquing the Data Studio dashboard.
In closing, I still am unsure how to feel about Google surfacing content questioning the legality or legitimacy of companies in their navigational brand searches. Below is the original table I put together from sites we have access to in Google Search Console. The numerical values are 12-month impressions for the phrase (or similar phrases). Yes, there is a time when a company is new to market where that question may have importance for users. I am not sure that a 30+-year-old established technology seller should have the same treatment.

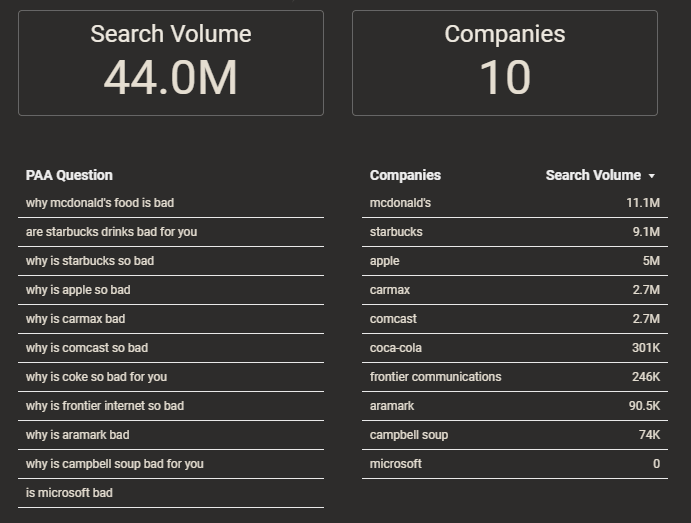
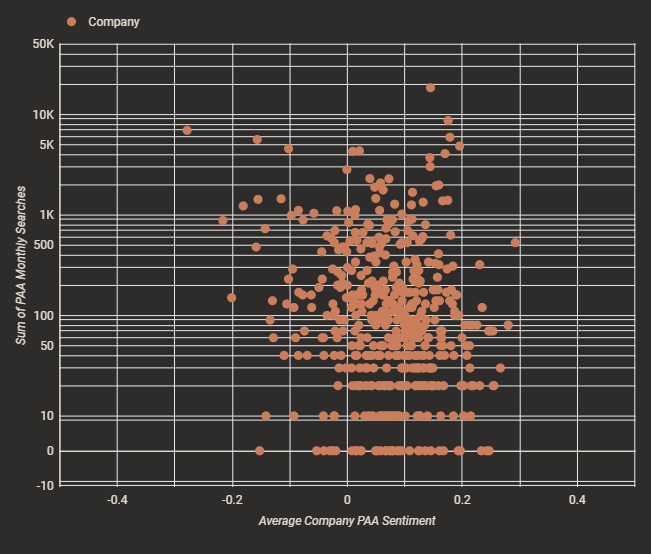
The awkward thing that struck me during this process was that the PAA results seem dissociated with actual user search interest and more driven by the content that is available online. “Why is coke so bad for you” has 20 monthly searches and is surfaced on a brand with millions of monthly brand searches. “Why is apple so bad” is searched by 70 people per month, but is surfaced for probably tens of millions of searchers per month. “Is walmart really shutting down” is searched zero times per month and is surfaced on a brand with 55M searches per month. To explore in more detail, we added a view to the Data Studio dashboard called “PAA Search Volume and Sentiment”, which shows that for the gross majority of companies, their combined PAA US search volume is less than 500.
The main takeaway here is that I think there is a line between answering a user’s query, whether positive or negative in sentiment from available content, and suggesting information actively that can substantively change a user’s perception of the topic being searched. This is especially relevant for navigational searches where in many cases the user is only using Google to get to a site, not asking for feedback on a company.
Contributing authors are invited to create content for Search Engine Land and are chosen for their expertise and contribution to the search community. Our contributors work under the oversight of the editorial staff and contributions are checked for quality and relevance to our readers. The opinions they express are their own.
Related stories
New on Search Engine Land
About the author