Crawl data analysis of 2 billion links from 90 million domains offer glimpse into today’s web
Data analysis reveals the distribution of PageRank is highly right-skewed meaning the majority of hosts have very low PageRank.
The web is not only essential for people working in digital marketing, but for everyone. We professionals in this field need to understand the big picture of how the web functions for our daily work. We also know that optimizing our customers’ sites is not just about their sites, but also improving their presence on the web, which it is connected to other sites by links.
To get an overall view of information about the web we need data, lots of data. And we need it on a regular basis. There are some organizations that provide open data for this purpose like Httparchive. It collects and permanently stores the web’s digitized content and offers them as public dataset. A second example is Common Crawl, an organization that crawls the web every month. Their web archive has been collecting petabytes of data since 2011. In their own words, “Common Crawl is a 501(c)(3) non-profit organization dedicated to providing a copy of the internet to internet researchers, companies and individuals at no cost for the purpose of research and analysis.”
In this article, a quick data analysis of Common Crawl’s recent public data and metrics will be presented to offer a glimpse into what’s happening on the web today.
This data analysis was performed on almost two billion edges of nearly 90 million hosts. For the purposes of this article, the term “edge” will be used as a reference to a link. An edge from one host (domain) to another is counted only once if there is at least one link from one host to the other host. Also to note that the PageRank of hosts is dependent on the number of links received from other hosts but not on the number given to others.
There is also a dependency between the number of links given to hosts and the number of subdomains of a host. This is not a great surprise given that of the nearly 90 million hosts, the one receiving links from the maximum number of hosts is “googleapis.com,” while the host sending links to the maximum number of hosts is “blogspot.com.” And the host having the maximum number of hosts (subdomains) is “wordpress.com.”
The public Common Crawl data include crawls from May, June and July 2019.
The main data analysis is performed on three following compressed Common Crawl files.
- Domain vertices [0.61GB]
- Domain edges [7.50 GB]
- Domain ranks [1.91 GB]
These two datasets are used for the additional data analysis concerning the top 50 U.S. sites.
The Common Crawl data provided in three compressed files belongs to their recent domain-level graph. First, in the “domain vertices” file, there are 90 million nodes (naked domains). In the “domain edges” file, there are their two billion edges (links). Lastly, the file “domain ranks” contains the rankings of naked domains by their PageRank and harmonic centrality.
Harmonic centrality is a centrality measure like PageRank used to discover the importance of the nodes in a graph. Since 2017, Common Crawl has been using harmonic centrality in their crawling strategy for prioritization by link analysis. Additionally in the “domain ranks” dataset, the domains are sorted according to their harmonic centrality values, not to their PageRank values. Although harmonic centrality doesn’t correlate with PageRank on the final dataset, it correlates with PageRank in the top 50 U.S. sites data analysis. There is a compelling video “A Modern View of Centrality Measures” where Paolo Boldi presents a comparison of PageRank and harmonic centrality measurements on the Hollywood graph. He states that harmonic centrality selects top nodes better than PageRank.
[All Common Crawl data used in this article is from May, June and July 2019.]
Preview of Common Crawl “domain vertices” dataset

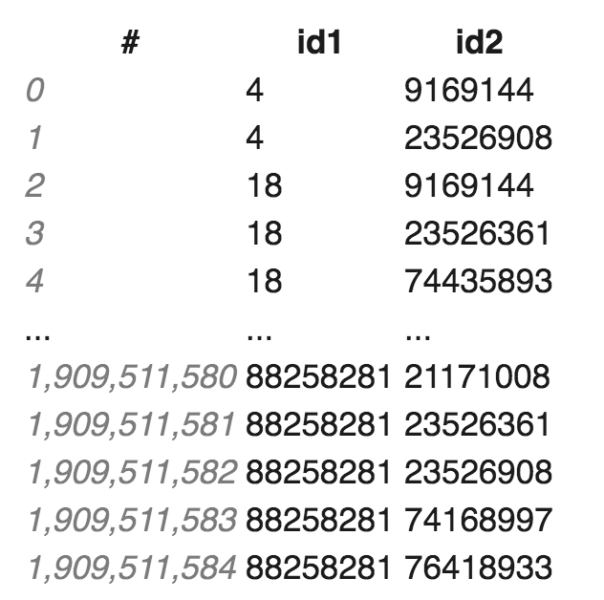
Preview of common crawl “domain edges” dataset
Preview of Common Crawl “domain ranks” dataset sorted by harmonic centrality
The preview of the final dataset obtained by three main Common Crawl datasets; “domain vertices,” “domain edges” and “domain ranks” sorted by PageRank

Column names:
- host_rev: Reversed host name, for example ‘google.com’ becomes ‘com.google’
- n_in_hosts: Number of other hosts which the host receives at least one link from
- n_out_hosts: Number of other hosts which the host sends at least one link to
- harmonicc_pos: Harmonic centrality position of the host
- harmonicc_val: Harmonic centrality value of the host
- pr_pos: PageRank position of the host
- pr_val: PageRank value of the host
- n_hosts: Number of hosts (subdomains) belonging to the host
Statistics of Common Crawl final dataset
*link : Counted as a link if there is at least one link from one host to other
- Number of incoming hosts:
- Mean, min, max of n_in_hosts = 21.63548751, 0, 20081619
- *The reversed host receiving links* from maximum number of hosts is ‘com.googleapis’.
- Number of outgoing hosts:
- Mean, min, max of n_out_hosts = 21.63548751, 0, 7813499
- *The reversed host sending links* to maximum number of hosts is ‘com.blogspot’
- PageRank
- mean, min, max of pr_val = 1.13303402e-08, 0., 0.02084144
- Harmonic centrality
- mean, min, max of harmonicc_val = 10034682.46655859, 0., 29977668.
- Number of hosts (subdomains)
- mean, min, max of n_hosts = 5.04617139, 1, 7034608
- *The reversed host having maximum number of hosts (subdomains) is ‘com.wordpress’’
- Correlations
- correlation(n_in_hosts, n_out_hosts) = 0.11155189
- correlation(n_in_hosts, n_hosts) = 0.07653162
- correlation(n_out_hosts, n_hosts) = 0.60220516
- correlation(n_in_hosts, pr_val) = 0.96545709
- correlation(n_out_hosts, pr_val) = 0.08552065
- correlation(n_in_hosts, harmonicc_val) = 0.00527706
- correlation(n_out_hosts, harmonicc_val) = 0.00440205
- correlation(pr_val, harmonicc_val) = 0.00400214
- correlation(pr_val, n_hosts) = 0.05847027
- correlation(harmoniccc_val, n_hosts) = 0.00042441
The correlation results show that the number of incoming hosts (n_in_hosts) is correlated with PageRank value (pr_val) and number of outgoing hosts (n_out_hosts), while the former is very strong, the latter is weak. There is also a dependency between the number of outgoing hosts and number of hosts (n_hosts), subdomains of a host.
Data visualization: Distribution of PageRank
The graph below presents the plot of the count of pr_val values. It shows us that the distribution of PageRank on almost 90 million hosts is highly right skewed meaning the majority of the hosts have very low PageRank.

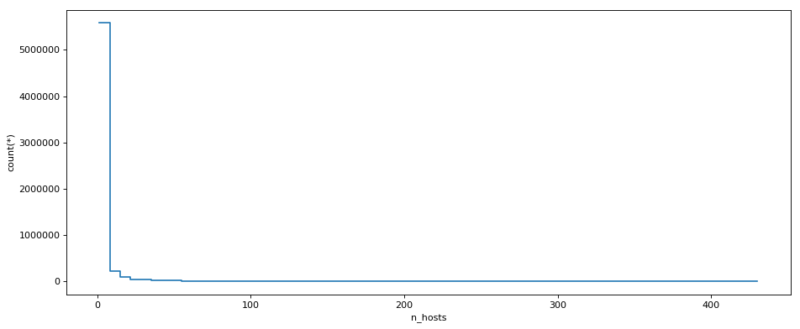
Distribution of the number of hosts
The following graph presents the plot of the count of n_hosts (subdomains) values. It shows us that the distribution of number of hosts (subdomains) of almost 90 million hosts is highly right-skewed meaning the majority of the hosts have a low number of subdomains.
Distribution of the number of incoming hosts
The graph below presents the plot of the count of n_in_hosts (number of incoming hosts) values. It shows us that this distribution is right-skewed, too.
Distribution of number of outgoing hosts
The following graph shows the plot of the count of n_out_hosts (number of outgoing hosts) values. Again, this distribution is also right-skewed.

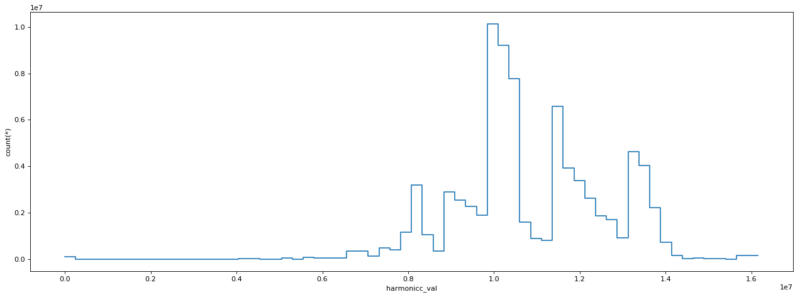
Distribution of harmonic centrality
The following graph presents the plot of the count of harmonicc_val column values. It shows that the distribution of harmonicc_val on almost 90 million hosts is not highly right-skewed like PageRank or number of hosts distributions. It is not a perfect gaussian distribution but more gaussian than the distributions of PageRank and number of hosts. This distribution is multimodal.
Scatter plot of number of incoming hosts vs number of outgoing hosts
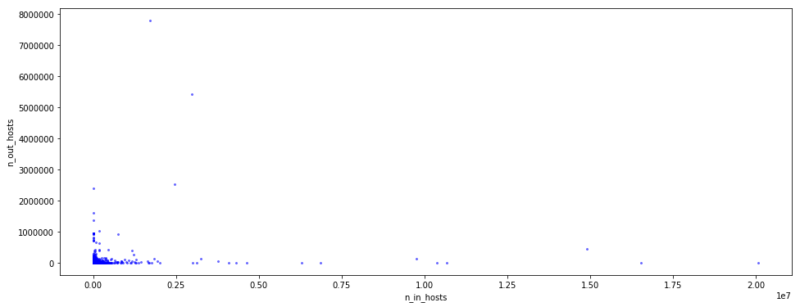
The graph below presents the scatter plot of the n_in_hosts in x-axis and the n_out_hosts in y-axis. It is showing that the number of outgoing and incoming hosts are not overall directly dependent on each other. In other words, when the number of links which a host receives from other hosts increase, its outgoing links to other hosts do not increase. When hosts do not have a significant number of incoming hosts, they easily give links to other hosts. However the hosts having an important number of incoming hosts are not that generous.
Scatter plot of number of incoming hosts vs. PageRank
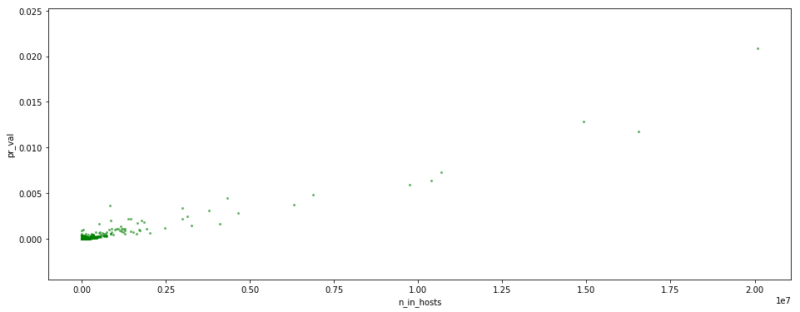
The graph below presents the scatter plot of the n_in_hosts values in x-axis and the pr_val values of hosts in y-axis. It shows us that there is a correlation between the number of incoming hosts to a host and its PageRank. In other words, the more hosts link to a host, the greater its PageRank value is.
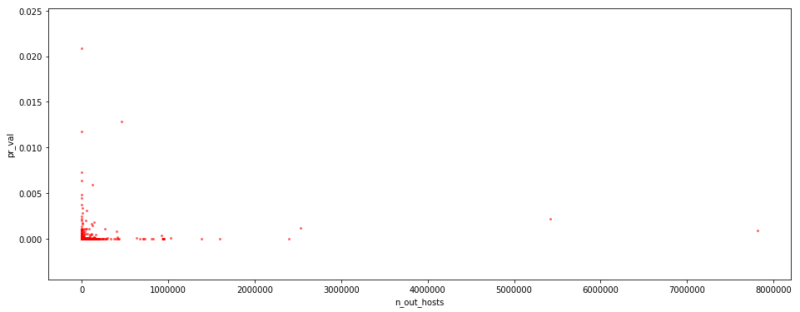
Scatter plot of number of outgoing hosts vs. PageRank
The graph below presents the scatter plot of the n_out_hosts in x-axis and the pr_val value of hosts in y-axis. It shows us that the correlation between the number of incoming hosts and PageRank do not exist between the number of outgoing hosts and the PageRank.
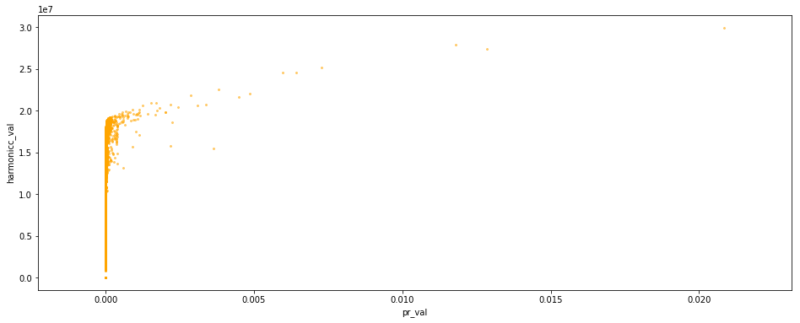
Scatter plot of PageRank and harmonic centrality
As the majority of hosts have low PageRank, we see a vertical line when we scatter plot the PageRank and harmonic centrality values of hosts. But, we observe the detachment of the hosts’ PageRank values from the masses begins when their harmonic centrality value is closer to 1.5e7 and accelerates when it is greater than.
Top 50 US sites
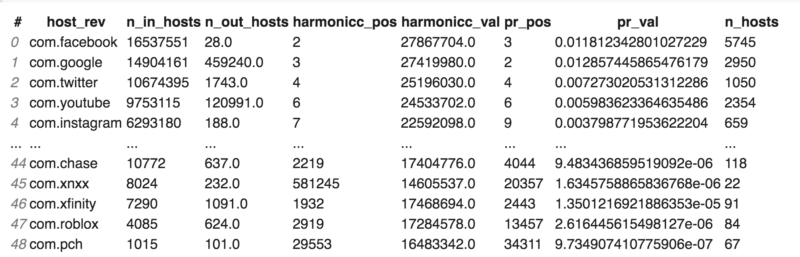
Top 50 U.S. sites data are selected from the final Common Crawl dataset obtained in the beginning. Their hosts are reversed in order to match with the column “host_rev” in the Common Crawl final data set. For example, “youtube.com” becomes “com.youtube.” Below is a preview from this selection. There are 49 sites instead of 50 because “finance.yahoo.com” doesn’t exist in Common Crawl dataset but “com.yahoo” does.

The Majestic Million public dataset is also imported. The preview of this file is below
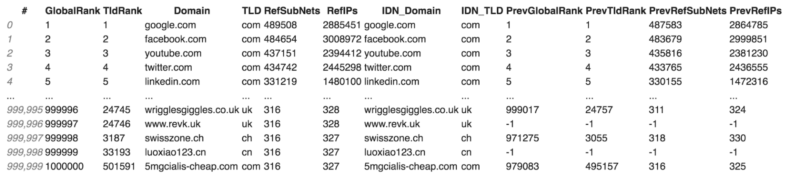
These two data sets; top U.S. 50 sites including Common Crawl data and metrics and the data set of Majestic Million are merged. The refips, refsubnets are summed up by reversed hosts.
The preview of this final dataset is below

Statistics of top 50 US sites final dataset
- Number of incoming hosts:
- mean, min, max of n_in_hosts = 1565724.63265306, 1015, 16537551
- Number of outgoing hosts:
- mean, min, max of n_out_hosts = 80812.70833333, 28., 2529655
- PageRank
- mean, min, max of pr_val = 0.00105891, 9.73490741e-07, 0.01285745
- Harmonic centrality
- mean, min, max of harmonicc_val = 18871331.16326531, 14605537., 27867704
- Number of hosts (subdomains)
- mean, min, max of n_hosts = 36426.79591837, 22, 1555402
From this dataset, which have the top 50 U.S. sites Common Crawl data and Majestic Million data, a pairwise scatterplot of metrics – pr_val, n_in_hosts, n_out_hosts, harmonicc_val, refips_sum, refsubnets_sum – are created can be seen below.
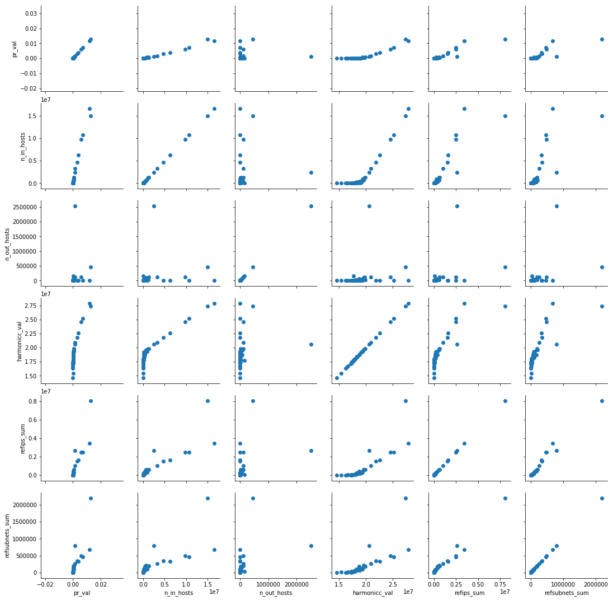
This pairwise scatter plot shows us that PageRank of the U.S. 50 top sites is somewhat correlated with all the metrics used in this graph except number of outgoing hosts, represented with legend n_out_hosts.
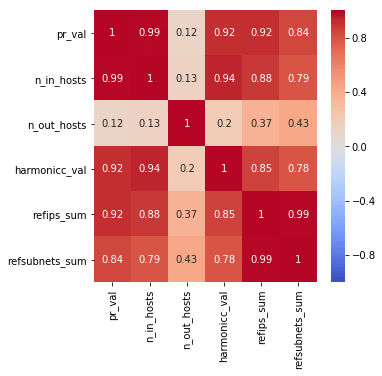
Below the correlation heatmap of these metrics is also available
Conclusion
The data analysis of the top 50 U.S. sites shows a dependency between the number of incoming hosts and referring IP addresses (refips) and the subdivision of an IP network that points to the target domain (refsubnets) metrics. Harmonic centrality is correlated between PageRank, number of incoming hosts, refIPs and refsubnets of the hosts.
Of the almost 90 million hosts ranks and their two billion edges (edges are links only counted once even if there are many from a single host), there is a strong correlation between PageRank and the number of incoming edges to each host. However, we can’t say the same for the number of outgoing edges from hosts.
In this data analysis, we find a correlation between the number of subdomains and the number of outgoing edges from one host to other hosts. The distribution of PageRank on this web graph is highly right-skewed meaning the majority of the hosts have very low PageRank.
Ultimately, the main data analysis tells us that the majority of domains on the web have low PageRank, a low number of incoming and outgoing edges and a low number of host subdomains. We know this because all of these features have the same highly right-skewed type of data distribution.
PageRank is still a popular and well-known centrality measure. One of the reasons for its success is its performance with similar types of data distribution comparable to the distribution of edges on domains.
Common Crawl is an invaluable and neglected public data source for SEO. The tremendous data are technically not easy to access even though they are public. However, it provides a once per three months “domain ranks” file that can be relatively easy to analyze compared to raw monthly crawl data. Due to a lack of resources, we can not crawl the web and calculate the centrality measures ourselves, but we can take advantage of this extremely useful resource to analyze our customers’ websites and their competitors rankings with their connections on the web.
Contributing authors are invited to create content for Search Engine Land and are chosen for their expertise and contribution to the search community. Our contributors work under the oversight of the editorial staff and contributions are checked for quality and relevance to our readers. Search Engine Land is owned by Semrush. Contributor was not asked to make any direct or indirect mentions of Semrush. The opinions they express are their own.


