• Search Engine Land
  • Sections
    • SEO
    • SEM
    • Local
    • Retail
    • Google
    • Bing
    • Social
    • Resources
    • More
    • Home
  • Follow Us
    • Follow
  • Search Engine Land
  • SEO
  • SEM
  • Local
  • Retail
  • Google
  • Bing
  • Social
  • Resources
  • Live
  • More
  • Events
    • Follow
  • SUBSCRIBE

Search Engine Land

Search Engine Land
  • SEO
  • SEM
  • Local
  • Retail
  • Google
  • Bing
  • Social
  • Resources
  • More
  • Newsletters
  • Home
SEO

Google PageSpeed Insights now uses real data from Chrome browser users

Google has revamped their pagespeed tool to give more insights into how fast their pages really load.

Barry Schwartz on January 10, 2018 at 8:47 am
  • More

Google announced that the PageSpeed Insights tool has been updated to use data from the Chrome user experience report, which means the tool is using metrics from “real-world Chrome users who experience popular destinations on the web.”

The pagespeed tool now shows you how fast your pages load based on real user data, which is an important metric for user satisfaction.

Pages are graded on these level:

  • Fast: The median value of the metric is in the fastest third of all page loads.
  • Slow: The median value of the metric is in the slowest third of all page loads.
  • Average: The median value of the metric is in the middle third of all page loads.

The tool provides these features now, as Google describes:

  • The Speed score categorizes a page as being Fast, Average, or Slow. This is determined by looking at the median value of two metrics: First Contentful Paint (FCP) and DOM Content Loaded (DCL). If both metrics are in the top one-third of their category, the page is considered fast.
  • The Optimization score categorizes a page as being Good, Medium, or Low by estimating its performance headroom. The calculation assumes that a developer wants to keep the same appearance and functionality of the page.
  • The Page Load Distributions section presents how this page’s FCP and DCL events are distributed in the data set. These events are categorized as Fast (top third), Average (middle third), and Slow (bottom third) by comparing to all events in the Chrome User Experience Report.
  • The Page Stats section describes the round trips required to load the page’s render-blocking resources, the total bytes used by the page, and how it compares to the median number of round trips and bytes used in the dataset. It can indicate if the page might be faster if the developer modifies the appearance and functionality of the page.
  • Optimization Suggestions is a list of best practices that could be applied to this page. If the page is fast, these suggestions are hidden by default, as the page is already in the top third of all pages in the data set.

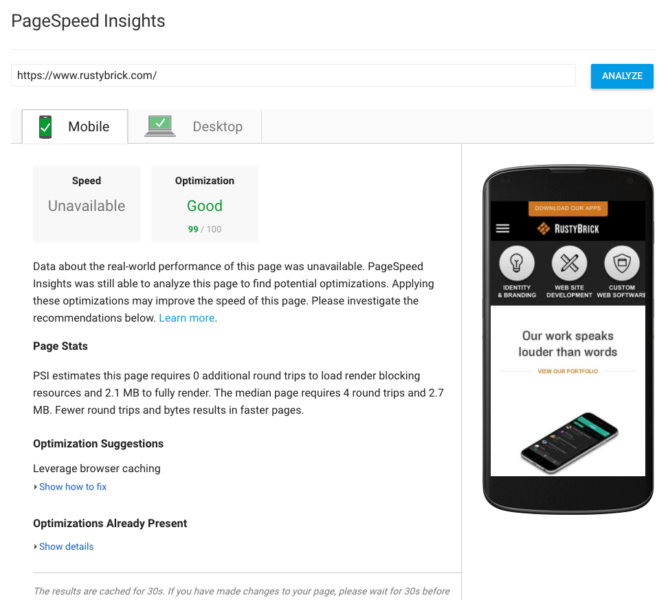
Here is a screen shot of the pagespeed report for this site:

Not all sites are graded; they need enough traffic and data from the Chrome user experience report to be graded. For example, my company site has no data for pagespeed:

You can learn more about the tool over here.


About The Author

Barry Schwartz
Barry Schwartz a Contributing Editor to Search Engine Land and a member of the programming team for SMX events. He owns RustyBrick, a NY based web consulting firm. He also runs Search Engine Roundtable, a popular search blog on very advanced SEM topics. Barry's personal blog is named Cartoon Barry and he can be followed on Twitter here.

Related Topics

Channel: SEOGoogle: SEOSEO: Site Speed

We're listening.

Have something to say about this article? Share it with us on Facebook, Twitter or our LinkedIn Group.

Get the daily newsletter search marketers rely on.
See terms.

ATTEND OUR EVENTS

Lorem ipsum doler this is promo text about SMX events.

February 23, 2021: SMX Report

April 13, 2021: SMX Create

May 18-19, 2021: SMX London

June 8-9, 2021: SMX Paris

June 15-16, 2021: SMX Advanced

August 17, 2021: SMX Convert

November 9-10, 2021: SMX Next

October 2021: SMX Advanced Europe

December 17, 2021: SMX Code

Available On-Demand: SMX

×


Learn More About Our SMX Events

Discover actionable tactics that can help you overcome crucial marketing challenges. Our next conference will be held:

MarTech 2021: March 16-17

MarTech 2021: Sept. 14-15

MarTech 2020: Watch On-Demand

×

Attend MarTech - Click Here


Learn More About Our MarTech Events

White Papers

  • A Beginner’s Guide to Omnichannel Marketing using Marketing Automation
  • The Top Five Objections That Hold Companies Back From Doing SEO
  • How To Optimize SEO With UGC
  • Email Tune-Up: A 5-Point Inspection to Get Your Program in Gear
  • Digital Marketing Report Q4 2020: Benchmarks and Insights for 2021
See More Whitepapers

Webinars

  • The Secret Behind SEO Success: Predict Rank with the Power of Data Science
  • How to Avoid the Digital Transformation Trap
  • How to Build a Marketing System of Record
See More Webinars

Research Reports

  • Local Marketing Solutions for Multi-Location Businesses
  • Enterprise Digital Asset Management Platforms
  • Identity Resolution Platforms
  • Customer Data Platforms
  • B2B Marketing Automation Platforms
  • Call Analytics Platforms
See More Research

h
Receive daily search news and analysis.
Search Engine Land
Download the Search Engine Land App on iTunes Download the Search Engine Land App on Google Play

Channels

  • SEO
  • SEM
  • Local
  • Retail
  • Google
  • Bing
  • Social

Our Events

  • SMX
  • MarTech

Resources

  • White Papers
  • Research
  • Webinars
  • Search Marketing Expo
  • MarTech Conference

About

  • About Us
  • Contact
  • Privacy
  • Marketing Opportunities
  • Staff
  • Connect With Us

Follow Us

  • Facebook
  • Twitter
  • LinkedIn
  • Newsletters
  • Instagram
  • RSS
  • Youtube
  • iOS App
  • Google Play

© 2021 Third Door Media, Inc. All rights reserved.

Your privacy means the world to us. We share your personal information only when you give us explicit permission to do so, and confirm we have your permission each time. Learn more by viewing our privacy policy.Ok