The Dynamics Of The Search Ad Marketplace: Dissecting A Moving Target
Columnist John Cosley of Microsoft shares insights about how Cost Per Click, Ad Click-Through Rate, and search volume organically evolve throughout the day.

In the real world, change is constant. What was true five minutes ago may not be true at this instant, and today’s “facts” can be proven utterly false tomorrow.
We all know this, and we accept it as part of life. So why do we search marketers rely on static, obsolete-the-moment-they’re-created charts to provide data we can act on?
This is a question I’ve pondered often, especially on days when I have dozens of those charts littering my desk (or, more often, my desktop).
A Better Way To See Data
Is there an alternative to all of those woefully inadequate charts? I decided to investigate.
My immediate goal was to understand how live marketplaces behave during the course of a day — and, if I was lucky, to see some of the small nuances that static screen grabs just don’t provide. The ultimate goal, of course, is simply to get more horsepower out of my campaigns.
To better understand how my campaigns actually behave, I took a video from the Bing Ads marketplace showing how Cost Per Click (on the Y-axis), Ad Click-Through Rate (on the X-axis) and volume of searches (size of bubble) organically evolve. The time zone has been normalized to users’ time.
The video provides insights into user behavior not just throughout the day (hour indicated in the top right corner), but also across devices:
Valuable Insights
The first revelation? Watching this is strangely addictive, sort of like binge-watching your favorite show, only without the guilt. But more importantly, the video uncovered some interesting time-based trends:
- In the earliest hours of the day, volume is relatively low, especially for PC. While that’s not unexpected at 1-2 a.m., the fact that CTR rates are especially low at that time was a surprise. For tablets, though, it’s a different story. In fact from the first hours of the day until about 5 a.m., we see mobile campaigns exhibiting higher CTR and lower CPCs than PC campaigns.
- At 5 a.m., conversion rates and volume begin to increase, and there’s a clear dip in mobile CPCs. Then, by 9 a.m., as consumers go online en masse and competition amongst advertisers increases for those coveted consumers, volume is up across the board and CPCs steadily increase.
- Over the course of the work day, we see a steady decline in CPCs — while volume and CTR remain relatively steady. (The lesson here? If you don’t want to lose valuable traffic, be sure you don’t burn out on your daily budget too early in the work day.)
- Once office workers return home around 7 p.m., they shift from productivity mode to entertainment mode, and with that, we see a declining CTR with steady CPCs. And as the evening progresses, volume slowly and gradually declines on PCs with those searchers still awake shifting to mobile phones and tablets.
Advertiser Take-Away
For advertisers, looking at the same data in a new way can provide a fresh perspective. Here are a few things to consider from this exercise:
- Somewhat similar CTR across PC and mobile devices may indicate that consumers interact with advertising the same way, no matter where they are.
- Mobile CPCs remain consistently lower than tablet and PC, but understanding how to value mobile traffic and building experiences that cater towards mobile devices are the key to unlocking this value.
- Tablet CTR is consistently a positive outlier and could be as much an indication of consumer state of mind while on these devices. Advertisers have an opportunity to capitalize on this trend with acquisition strategies and consumer experiences geared toward tablet use.
- Tablet and PC CPCs remain relatively in synch, indicating that from a cost perspective, consumers behave similarly across a tablet and a PC.
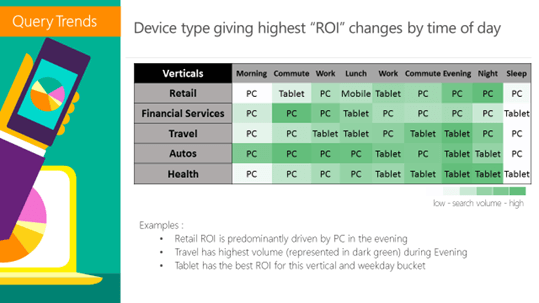
Verticals matter, too. And while not part of the video, this is worth mentioning. What works in one vertical doesn’t necessarily work in another.
As you can see in the chart below, there’s significant variation in ROI by vertical — depending on both device and time of day.
Regardless of what vertical market you’re targeting or what product you’re selling, the video shows there is a clear correlation across all devices, indicating a cross device strategy is essential in capturing your full customer potential.
For the many advertisers that are struggling to do that, this insight may give you the extra push you need. Mining data for insights is our job as marketers. And, let’s face it, the job can be a bit like solving a mystery — sometimes tedious, but incredibly rewarding when you succeed.
Seeing data in motion, just as it is in real life, provides just that kind of reward. And I, for one, can’t wait to see where it leads us next.
Contributing authors are invited to create content for Search Engine Land and are chosen for their expertise and contribution to the search community. Our contributors work under the oversight of the editorial staff and contributions are checked for quality and relevance to our readers. The opinions they express are their own.
Related stories
About the author