Will AMP improve your rankings? How to set up an AMP test
Wondering if AMP is worth the investment? Columnist Stephanie LeVonne walks through how to set up a test to determine what kind of boost, if any, you can expect from implementing AMP across your mobile site.

Though Google has repeatedly stated that Accelerated Mobile Pages (AMP) are not a ranking factor, many have speculated that they may soon become one. AMP pages are built for speed — so when you consider Google’s recent announcement that page speed will become a mobile ranking factor later this year, right around the same time the full rollout of the mobile-first index is expected, it certainly seems possible that mobile sites with AMP implemented could soon see a boost in rankings and traffic.
Even so, the conversation around convincing clients to implement AMP is often fraught with concern about wasting both time and resources. In fact, many SEOs make the counterargument that why even implement AMP when you could just build lightning-fast mobile pages to begin with? However, that’s a story for a different day.
The fact is that for most sites, mobile pages built with AMP are likely to outperform existing mobile pages in terms of speed. But if you, or a client, are skeptical about the benefits of implementing AMP, consider running a small-scale test. Below, I’ve outlined a test setup for selecting, tracking and reporting on a series of AMP “test pages.” With the insights from this test in hand, you can make a calculated decision about whether the cost of a sitewide AMP rollout will yield a substantial ROI for your business.
Selecting test pages
Regardless of what industry or vertical you work in, choosing the right sample set of pages to test is the most critical step in the entire process.
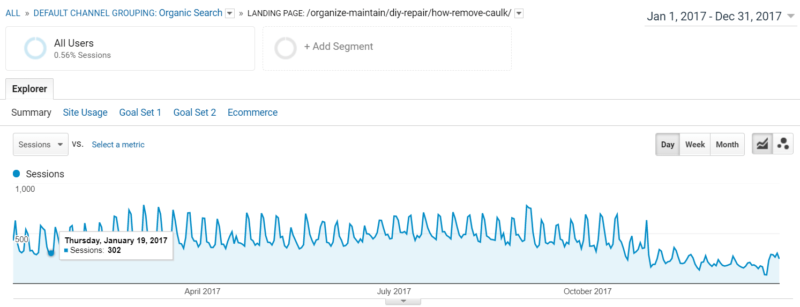
First, you’ll want to look at Google Analytics and sort your organic pages for mobile traffic. Once you’ve identified the top-performing landing pages, you’ll need to assess which, if any, experience seasonality and weed these out of the mix. An easy way to check for this is to set your date range for a full year and examine the data for any spikes. If you have a business which is strictly seasonal, such as lawn care, consider running the test in either the peak season or during a lull. However, avoid testing during a transitional period, such as when sales drop off in August, leading into the fall.
Next, you’ll need to decide how many pages your test will include. I recommended no less than 25 pages (my test included 27) and no more than 50, since you’ll be manually pulling most of this data from Google Search Console one URL at a time. Keep in mind you’ll want these pages to have a significant amount of traffic as well.
Setting the test duration & gathering benchmark data
Since you’ll want to gather both pre-launch and post-launch data, the duration of your test may range anywhere from 60 to 180 days. I recommend gathering at least 60 days’ worth of pre-launch data and 90 days’ worth of post-launch data.
Check AMP setup in Google Search Console
After you’ve selected your test pages, the next step is to build and implement AMP for those pages. Once you do so, you’ll probably be excited to hit the ground running, but remember to first check out the Accelerated Mobile Pages report in Google Search Console to ensure that your pages have been set up correctly. Your test won’t help you much if you’re collecting faulty data!
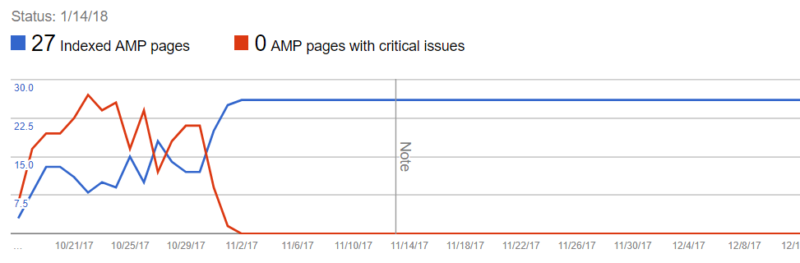
In the example below, you can actually see that a number of our AMP pages had critical issues that needed to be resolved. Once all critical issues were remedied, we began collecting AMP data on November 3, 2017.
Pulling data
With the rollout of the new Google Search Console, webmasters and SEOs now have access to up to 16 months of data (as opposed to the former 90-day window), which lends you a bit of flexibility in terms of when you should pull your data. When pulling pretest data, you’ll want to pull performance data for the standard, non-AMP URL. I recommend using the Search Analytics report (in the old Google Search Console) or the Search Performance report (in the new Google Search Console) and filtering by Device: Mobile.
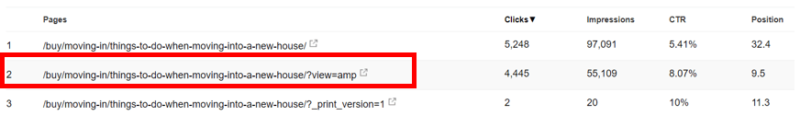
For pulling post-launch data, you may notice that Google has statistics for both the AMP and non-AMP URL, which indicates that Google sometimes shows your standard URL instead of your AMP page (this may have something to do with the user query). Nonetheless, make sure you are pulling data for the AMP-only URL, since this is the one we want to test:
Setting KPIs
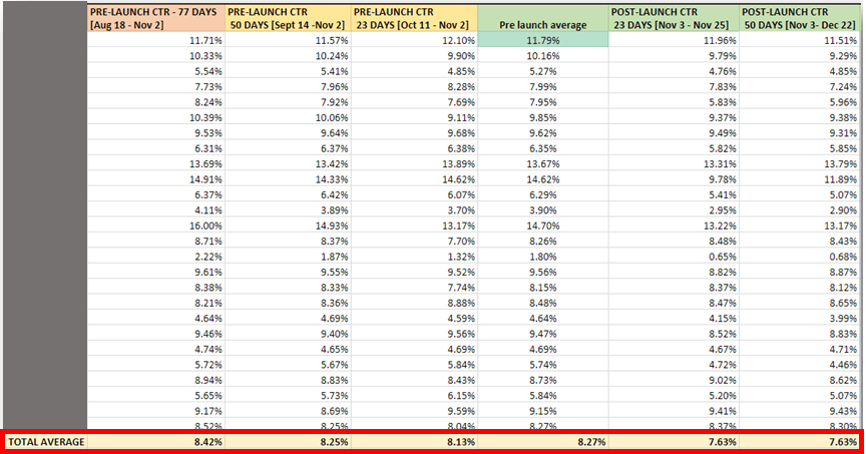
For the purpose of this test, we used click-through rate (CTR) as the main KPI in order to determine if increased visibility (presumably due to higher rankings) was leading more people to click. However, this is where it gets a little muddy. Correlation does not imply causation, especially in instances where you’re performing other SEO optimizations, so take your data with a large grain of salt.
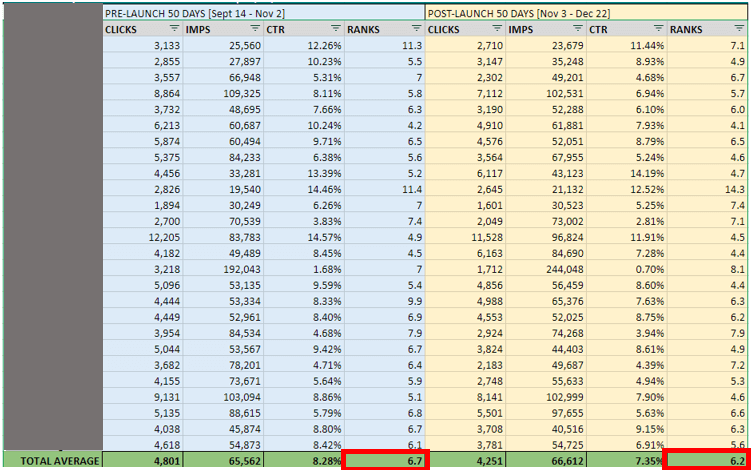
In fact, in our test, CTR seemed to be slowly declining; however, rankings were increasing! Again, other SEO optimizations could come into play here. What we determined was that the increase in rankings was naturally leading to more impressions, which led to more clicks. The issue was that impressions had increased exponentially more than clicks, which resulted in a lower CTR. Confused yet?
Average CTR Metrics
Average Mobile Impression Metrics

In order to keep things simple, I recommend looking at positioning (rankings) over time and taking the average. As you can see in the test below, our 50-day prelaunch average ranking was 6.7, compared to 6.2 in 50 days post-launch.
Ideally, before making any decisions, you should review 90 days’ worth of post-launch data, which may yield more significant improvements in rankings. One thing is clear from our test, though: For us, overall rankings did improve over time (Results may vary for other sites, though, which is why you should test it for yourself).
There are definitely other ways to slice and dice this data; however, if you’re looking to easily test AMP performance, this is about as close to foolproof as you can get.
Contributing authors are invited to create content for Search Engine Land and are chosen for their expertise and contribution to the search community. Our contributors work under the oversight of the editorial staff and contributions are checked for quality and relevance to our readers. The opinions they express are their own.
Related stories
New on Search Engine Land
About the author