Data-Led Inbound Marketing, Part 2
Columnist Chris Liversidge shows how a streamlined, data-led process can be used to set clear priorities and objectives that drive both social and SEO performance over time.

This is a follow-up to my post at the end of 2015, which looked at how you can take third-party tools and merge their data to create weighted segment reports that allow you to better target inbound link building campaigns.
This time, I’d like to focus on quantifying actions and impact so you can build data-led inbound strategies from the ground up.
I’ll share the outputs of that analysis, using our surfing key phrase sets to show the types of inbound content triggered by the analysis. And I’ll discuss how to embed them into a broader campaign planner to provide a performance-driven SEO planner you and your team can work through.
Mining Your Performance Data For Insights
Using our weighted Estimated True Value (ETV) model to find the best blend of positive social metrics and positive link data, we can segment our data to look at high-performing data like this:
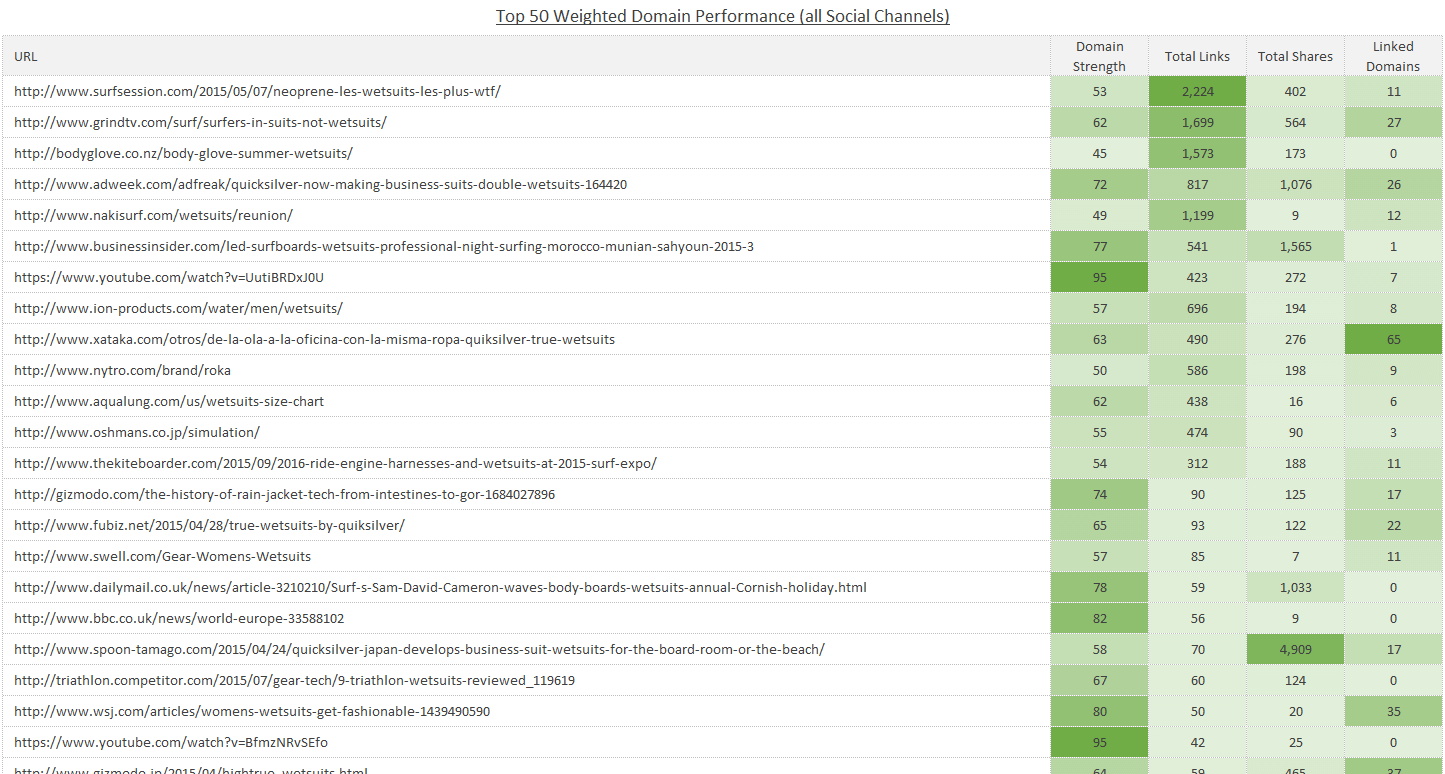
Sorting data by our weighted ETV highlights the best blend of link volume, domain strength and diversity and social engagement metrics. (Click to enlarge)
In this example, I’ve aggregated the social interaction across multiple social channels: LinkedIn, Twitter, Facebook and Google+. However, you can pivot the data to segment by each, should you so choose, and I’d recommend that approach if you know one particular social channel is more valuable to your marketing message than another.
We can see that our top-performing content has a common campaign dominating the ETV sorted data:

A single campaign takes multiple top spots in our report view. (Click to enlarge)
Quicksilver Japan’s “True wetsuits” campaign, rolled out in Spring/Summer 2015, has had excellent results across our data set for social impact that drives a high volume of high-value links from a diverse domain mix: the perfect storm and a great model for effective SEO and social campaign success crossover.
The actual YouTube video is ranked underneath a light-hearted Adweek press summary and follow-on posts by GrindTV and Surf Session (both of which embed the YouTube video). Crucially, the top-performing item goes into further detail on the range itself, pulling out different styles and options and pulling in other press content imagery that adds greater depth to the video.
It’s also very obvious that this top-performing article content isn’t from the original release country.
So what are our takeaways? Well, we can see that niche site performance is a trend; in addition to the two previous examples, Nakisurf also performs strongly.
Embedding the release video is important, and provision of additional release collateral — going the extra mile to tell the full story and support the message of the release — has worked strongly.
Also, and most importantly, our target audience is global. When we consider the other high-ranking content around our target terms in the report, we can see the UK version of Business Insider, a new Zealand stockist, ION’s US site and a Spanish editorial on the Quicksilver campaign from Xataka.
So in addition to having go-to sites and social influencers that are highly valued in our target niche from the report (and supporting data in the previous part), we have much clearer definition on the content that succeeded for those publications:
- Clear, catchy, light brand message, expressed via video storytelling, tone matched to product lifestyle.
- Supporting product range information (detail, detail, detail!).
- Supplying technical specification in depth (2 mm. neoprene and so on),
- High-resolution PR shots made available, extensive shots from filming made available.
- Targeted launch outreach to international publications.
- Lightweight light opinion/release pieces targeted to niche publications to support.
- Follow-up campaign collateral and opinion pieces two to three weeks after initial campaign promotion (see Xataka).
- Remove language barriers in collateral.
It goes without saying there are further tone and messaging learnings to be had from reviewing the social promotion during the campaign, and I recommend using a tool like True Social Metrics to gain visibility on the archived fire hoses from your key social channels and to perform sentiment and tone analysis to validate your approach success.
Looping launch planning into these data insights is straightforward. Choosing the right projects to work on and prioritize simply requires comparison. Because we start our process by choosing key phrase targets, we can rerun our reports for multiple terms or sets of terms to gain output like the above and compare the absolute numbers (Domain Strength, Link Volume, Strength, Diversity), to prioritize those that have higher impact.
Align that list of high-impact content areas with your current content and PR planner, and you can conduct a rationalization piece to set your priorities. After that, you need to define your baseline KPIs and agree on what success looks like. We can use the same data sources to set that.
Benchmark To Measure Growth
I often speak to businesses that are slipping behind their competitors’ SEO or social performance, and invariably there is a lack of appropriate benchmarking that underpins their underperformance.
Let’s use an example benchmark to illustrate the point.
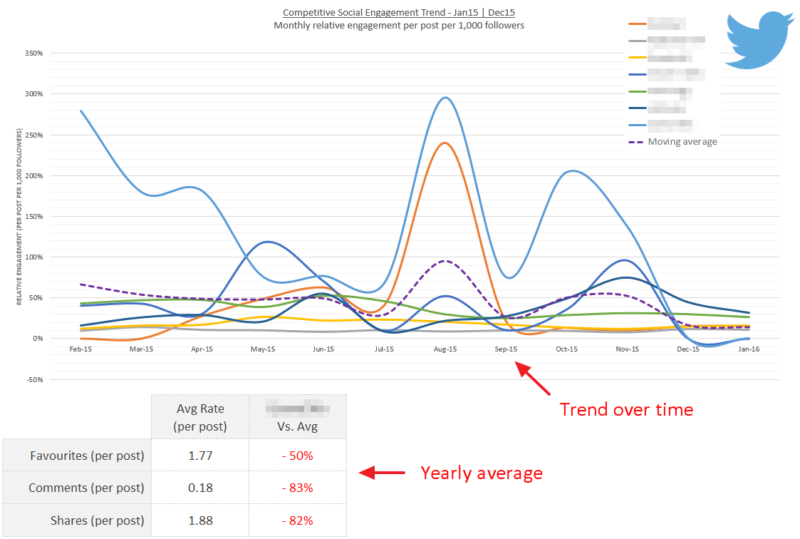
Re-visualising True Social Metrics data and calculating a moving average to benchmark gives a clearer starting point.
The benchmark above shows, for Twitter only, the “Social Engagement” rates for seven brands and a calculated “Moving Average” of the group. The underlying data is from True Social Metrics, and their key engagement types are highlighted for a single domain versus the moving average.

Absolute numbers give context to our benchmark.
Providing further context to the existing reach of competing profiles is important for social, and so in the above part of the benchmark, we frame the engagement rates in absolute terms.
This is an excellent starting engagement point to measure social improvement from and dovetails with the previous report to supply a baseline you can use to show improvement over time.
Setting SMART objectives against increasing engagement rates against your selected competitor moving average, increasing follower counts to allow for future campaign amplification and backfilling seasonally slow times for social will all merge with the content priorities discussed as outputs from the weighted true value inbound campaign analysis.
So although we are jumping across multiple tools, I hope it’s clear that a streamlined, data-led process can be used to set clear priorities and understandable SMART objectives that drive both social and SEO performance over time in a virtuous cycle.
Contributing authors are invited to create content for Search Engine Land and are chosen for their expertise and contribution to the search community. Our contributors work under the oversight of the editorial staff and contributions are checked for quality and relevance to our readers. The opinions they express are their own.
Related stories
New on Search Engine Land
About the author