How Analytics Can Help Balance Your Annual Search Advertising Budget
At the online marketing agency I work for, we primarily focus on ROI driven online marketing campaigns. With this marketing philosophy, search engine advertising (SEA) budgets don’t play a role, and as long as every order delivers profit / ROI, the SEA budget should be endless. Of course, this ideal situation doesn’t happen at a […]
At the online marketing agency I work for, we primarily focus on ROI driven online marketing campaigns. With this marketing philosophy, search engine advertising (SEA) budgets don’t play a role, and as long as every order delivers profit / ROI, the SEA budget should be endless.
Of course, this ideal situation doesn’t happen at a lot of organizations. They are working with half-year or yearly SEA budgets set at the beginning of each year.
These search advertising budgets are mostly divided by the number of months and maybe a little extra in the busiest months of the year. But is this really the best way to divide a fixed SEA budget in order to get the highest ROI?
In this article, I will explain how Google Analytics can help you in determining how to divide your SEA budget across the different months in a year.
Trend-Sensitive Markets
Most organizations operate in a trend-sensitive market, although some in low trend-sensitive markets (like online supermarkets) and some in high trend-sensitive markets (like online travel). Related to these trends are the search volumes and the number of clicks an organization can get from Google, Bing or any other search engine in a specific month.
If the SEA budget is evenly divided across the months, it could happen that in one month, the budget is depleted on the 15th and in another month, there is still budget left at the end. This clearly isn’t the way to get the highest possible ROI.
Budgeting Using Google Analytics
In order to use Google Analytics for this example calculation, we need a full year of accurate data. In the figure below, we see the visits data for a trend-sensitive market like travel, with peaks in January and around July.
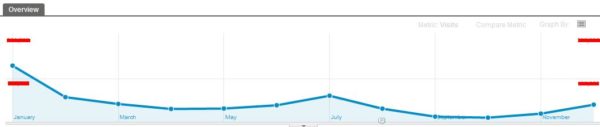
For the example calculation, we will use a yearly SEA budget of $600,000, which would normally be $50,000 a month.
In this case, we will use the export function within Google Analytics to get the monthly figures.
After this, we will calculate the new budget for each month with the following equation:
(number of visits for a specific month / total number of visits in 1 year) * total SEA budget = adjusted SEA budget for a specific month
If we execute this calculation on the monthly visits from Google Analytics we will get the following table:
| Month | Visits | Normal budget | Adjusted budget | Difference |
| Jan | 199.838 | $50.000,00 | $155.710,21 | $105.710,21 |
| Feb | 88.207 | $50.000,00 | $68.728,96 | $18.728,96 |
| Mar | 63.853 | $50.000,00 | $49.753,11 | -$246,89 |
| Apr | 46.117 | $50.000,00 | $35.933,40 | -$14.066,60 |
| May | 47.649 | $50.000,00 | $37.127,34 | -$12.872,66 |
| Jun | 59.191 | $50.000,00 | $46.120,89 | -$3.879,11 |
| Jul | 93.407 | $50.000,00 | $72.781,16 | $22.781,16 |
| Aug | 47.124 | $50.000,00 | $36.718,16 | -$13.281,84 |
| Sep | 18.848 | $50.000,00 | $14.686,07 | -$35.313,93 |
| Oct | 15.166 | $50.000,00 | $11.817,01 | -$38.182,99 |
| Nov | 29.402 | $50.000,00 | $22.909,25 | -$27.090,75 |
| Dec | 61.237 | $50.000,00 | $47.714,41 | -$2.285,59 |
| Total | 770.039 | $600.000,00 | $600.000,00 |
As we see, the numbers show a huge difference between a normal distribution of the SEA budget and a distribution based on Google Analytics data. With the calculation based on Google Analytics data, we are better prepared for the trends in the market and don’t run out of budget in the middle of a month.
A small note to this calculation is that we are using “old” data and it is only a prediction of what the trend could be in the future.
You can make the same calculation with Google Insights for Search data. If we look at the graph for the US in 2010 on the keyword “sunglasses” we see the following figure:
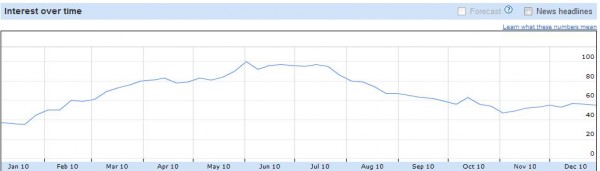
The sunglasses industry is obviously also a trend-sensitive market. What we could do is download the data from Google Insights for Search as a CSV. This data on a weekly level shows the index numbers for a specific week.
If we want to calculate the SEA budget for a specific week, we could use the following equation:
(indexnumber for a specific week / total sum of indexnumbers for all weeks) * Total SEA budget = adjusted SEA budget for a specific week
I think this article may help you to better divide your search engine advertising budget across the year and to get even higher ROI on you SEA campaigns. Please let me know in the comments how you calculate the distribution of your SEA budget across all months.
Contributing authors are invited to create content for Search Engine Land and are chosen for their expertise and contribution to the search community. Our contributors work under the oversight of the editorial staff and contributions are checked for quality and relevance to our readers. The opinions they express are their own.
Related stories
New on Search Engine Land
About the author