5 Steps To Leverage Those AdWords Bid Simulations For Maximum Return
Though the basic concepts have remained the same, a lot has changed since Hal Varian released his bidding tutorial back in 2009 (video autoplay), especially with enhanced campaigns and those new mobile and location bid modifiers. One such change is that keyword-level simulations are now available for download in AdWords. For any search marketer interested in marginal […]
Though the basic concepts have remained the same, a lot has changed since Hal Varian released his bidding tutorial back in 2009 (video autoplay), especially with enhanced campaigns and those new mobile and location bid modifiers.
One such change is that keyword-level simulations are now available for download in AdWords. For any search marketer interested in marginal cost and revenue numbers — essentially how diminishing returns affect your paid search program — those simulations can be a great source of knowledge. Below are some thoughts on how to leverage them.
1. Pull Those AdWords Keyword Bid Simulations
In AdWords, you want to add all columns from the “Bid simulator” section. Also, you might want to use a long enough time period so you can get a fairly significant conversion rate and average-order-value (AOV) numbers at the keyword level — we’ll use those later.

For the sake of this exercise, I am using a 12-week-long report. Also, my AdWords account has conversion and revenue data, which is convenient — otherwise, I’d have to pull a report from a third-party tool, then plug it in here.
2. Put The Data Together In Excel
Essentially, we want to map those AdWords simulations, which provide weekly click and cost simulations, together with our average conversion rates and average order values (from AdWords or any third-party tool). Based on those additional click and cost estimates, we can calculate the estimated CPC, additional conversions, revenue and ROAS (Return-On-Ad-Spend) for all keywords.
This can be done using simple formulas, or calculated fields if you are more pivot-table adept. Either way, we are going to need the following calculations:
Conv. Rate = ‘Conversions/Clicks’
AOV = ‘Total conv. value/Conversions’
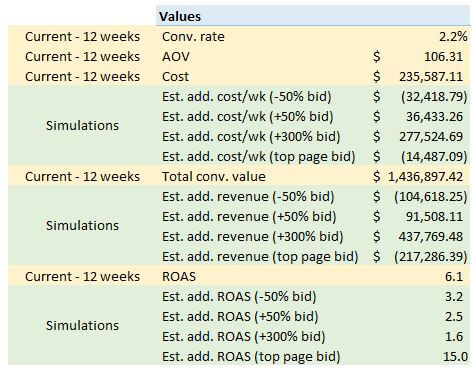
Those two calculations will be used in the simulations, assuming that both the conversion rates and AOV remain stable. Then, the below calculations will be used in conjunction with the conversion rate and AOV numbers:
Est. CPC (+50% bid) = ‘Est. add. cost/wk (+50% bid)’ / ‘Est. add. clicks/wk (+50% bid)’
Est. add. conversions (+50% bid) = ‘Est. add. clicks/wk (+50% bid)’*’Conv. rate’
Est. add. revenue (+50% bid) = ‘Est. add. conversions (+50% bid)’*AOV
Est. add. ROAS (+50% bid) = ‘Est. add. revenue (+50% bid)’/’Est. add. cost/wk (+50% bid)’
Etc…
The process is tedious the first time, so you might want to build a clean template that you can re-use in the future. Basically you should end up with the following type of pivot table, where you can see your current performance (12 weeks of data in this example), and AdWords simulations (always 1 week of data):
3. Determine Bid Simulations’ Coverage
While this is somehow optional, you might want to know how often Google is able to provide bid simulations, given that lots of keywords drive a very small amount of impressions and clicks.
In order to measure this, you can simply count the number of keywords with a simulation over the total number of keywords in your account. Interestingly, it seems those simulations are now available across most keywords, which is great.

4. Aggregate Simulations & Understand High-Level Trends
For those keywords with available simulations, we can easily aggregate all those (-50% bid) simulations, (+50% bid) simulations, (+300% bid) simulations, and (top page bid) simulations, and visualize where the program would be, cost- and revenue-wise, if we followed AdWords’ suggestions.
Note that we still need to translate those weekly additional estimates into weekly total estimates. Those high-level numbers are interesting as they provide some hard numbers on the relationship between cost and revenue, as well as theoretical room for growth (+300% bid).
However, those should only be considered as directional, as it would obviously be sub-optimal to apply similar bid changes across all keywords.
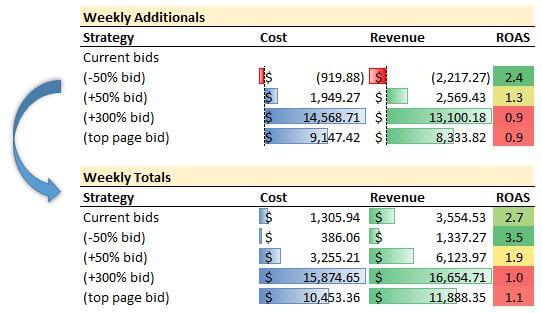
Then you should be able to visualize these high-level simulations type as a yield curve:

5. Delve Into Keyword-Level Marginal ROAS For Improved Insights
As noted earlier in this post, those aggregated simulations can only be directional, as every individual keyword should be analyzed separately, cost- and revenue-wise, in order to determine the optimal bid.
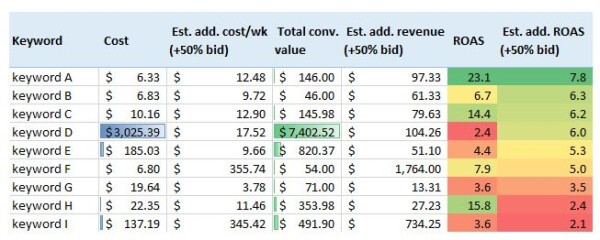
In the below example, I have sorted my keywords by descending “Est. add. ROAS (+50%)” — that is, those keywords with the greatest marginal ROAS out there if increasing the bids by 50%. This is where I want to invest more money and get incremental revenue from.
Note that the keywords with the greatest marginal ROAS are not necessarily those with the greatest average ROAS. For instance, keyword B has the 2nd highest marginal ROAS while it only has the 5th highest ROAS. As a result, those search marketers still using AdWords to manage their bids can now easily optimize those based on the marginal ROAS, as opposed to the old-fashioned average ROAS.
Conclusion
Hopefully, this post will help search marketers take advantage of AdWords new bid simulator columns, or at least get familiar with basic marginal cost and revenue concepts. Keep in mind that, as Google says, those simulations “aren’t meant to serve as predictions or guarantees of future ad performance.”
Also, from my experience, those simulations are mostly reliable for non-branded exact keywords, not so much for phrase/broad keywords nor branded keywords in general. That being said, it is nice to see that Google is becoming more transparent and now provides better tools for search marketers to make more informed decisions.
Contributing authors are invited to create content for Search Engine Land and are chosen for their expertise and contribution to the search community. Our contributors work under the oversight of the editorial staff and contributions are checked for quality and relevance to our readers. The opinions they express are their own.
Related stories
New on Search Engine Land
About the author