A script to create a Google Ads Experiments dashboard
This script generates a dashboard with a comprehensive view of experiments across My Client Center.
Despite the constant addition of new
Sadly, testing at scale can be a bit of a pain due to the lack of an experiment dashboard in Google Ads. That’s why I’m sharing a free Google Ads script that generates an experiment dashboard and makes it easier for advertisers to stay on top of the experiments they’re doing.
Why we need an Experiment Dashboard
I wrote this script for a few reasons:
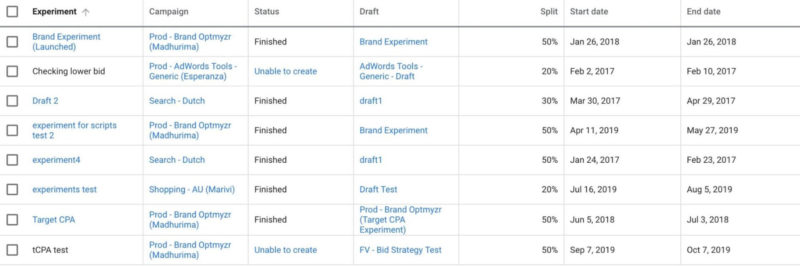
- There is no place in Google Ads to see all experiments across My Client Center. You can only see experiments for one account at a time as illustrated in the screenshot below.
- The experiment page shows only the most basic details. It doesn’t indicate winners and losers, or even show a comparison of metrics between the control and experiment. The only way to get that data is by clicking on each experiment to see its results and that seems like a waste of time.
PPC rockstars are great at testing
I made the point in my book that testing is a key skill that sets a great PPC expert apart from a mediocre one. There are a few elements to being an expert tester and a PPC rockstar:
- Be smart about what you test. Know from experience what is a likely experiment to drive results and test that. Don’t waste money on ridiculous tests that are unlikely to drive significant positive outcomes.
- Know how to test rapidly. When experiments take too long to reach a conclusion, they are bottlenecking the account’s ability to improve. Two fairly common scenarios for when tests take too long come to mind: (1) when the base campaign doesn’t have enough volume and splitting the traffic will result in too little data over the course of a reasonable test period which will make identifying a winner take too long, or (2) there is lots of data but the control and experiment remain statistically tied and the experiment is allowed to continue to run past the time when a winner could have been identified if there were one.
Slow testing applied to Quality Score
When I worked at Google, one of the worst updates to the relevance system that I can remember was when we decided to give advertisers the ability to prove Google’s assessment of their keyword quality was wrong. I was on the team at the time so I had my share of the blame.
Before the change, keywords deemed irrelevant were simply disabled automatically and advertisers had no recourse. So to restore some control, it was decided that every advertiser would get a small allowance to test low relevance keywords. The idea was that rather than quickly disabling keywords, we’d let advertisers experiment with a few keywords the quality system was not fond of so that there’d be clear evidence whether the human or the machine was right.
The problem was that the system automatically picked which keywords to test from each advertiser’s account. Rather than prioritizing high volume keywords that could quickly be tested to
In 2005, the concept of ‘in trial’ keywords was scrapped and modern Quality Score was introduced.
What the Experiment Dashboard script does
So testing is important, and doing it well is even more important. But when you have to stay on top of lots of tests, possibly across many accounts – like if you’re an agency – it can be a huge time waster because there is no one place to go and see all results. That is why I created this script.
The script fetches all the experiments across an MCC account or for an individual account (be sure to grab the appropriate version at the end of this post depending on whether you are placing it in an MCC or an individual account).
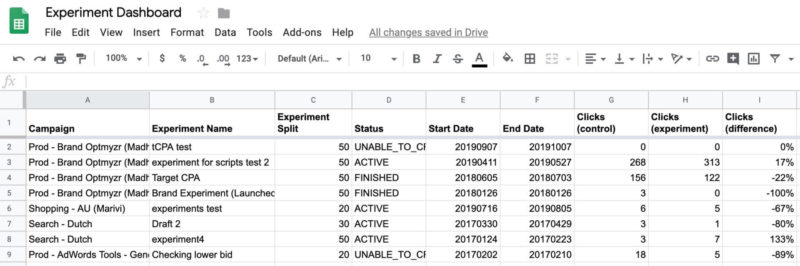
The script figures out the dates for each experiment – keeping in mind that each experiment may have run for a different time frame – and gets the key metrics like conversions, costs, etc. It also gets the traffic split between the control and experiment so that it can calculate the difference in observed performance as if the traffic had been split evenly.
Finally, it adds the data to a Google Sheet. One line per experiment, including the performance metrics. With this spreadsheet-based dashboard, advertisers can monitor performance across a multitude of experiments from a single view.
How to create an experiment in Google
Now that we have a better way to monitor experiments, let’s briefly cover the mechanics of how to create experiments in Google Ads.
Advertisers start by creating a draft campaign based on an existing campaign. Once the draft has been set up with everything the advertiser wants to test, it can be promoted to an experiment. When creating the experiment, the draft is allocated a percentage of traffic (the traffic split) and a start and end date. It then becomes an experiment and the base campaign becomes
Future changes to the base campaign – the control – will not be applied to the experiment. Hence if you want meaningful results about the experiment, you need to be careful about what you change in the control or make changes to both the control and experiment at the same time.
Keep in mind you can and should make changes in the control. For example, when testing manual versus automated bidding, you should manage bids as you intend to in the control. But you shouldn’t add new keywords because that changes a factor unrelated to what you’re trying to measure as part of the experiment.
Once the experiment has ended, the advertiser can decide whether to discard or promote it and replace the control. If promoted, whatever is in the experiment gets moved to the original campaign and that then runs again on 100% of traffic until a new experiment is started.
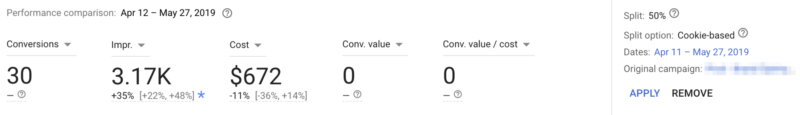
Google provides the results of an experiment only by clicking into the experiment details.
Conclusion
Improving PPC accounts requires careful testing of the many new options that are constantly announced by Google. Accounts get better when winning experiments are merged into the account. And PPC rockstars get better by building knowledge of what works well, and when, and applying these findings to start higher quality experiments on future accounts.
I will be at SMX East on Nov. 13 to lead a session called “Awesome Tests, Profitable Results,” where I will share more details about this script as well as the methodology and results of my own experiments. I hope you’ll give the script a try and join me in New York for SMX.
The script
Grab this code if you want a single account dashboard and will copy the code into an end-account:
Grab this code if you want an MCC experiment dashboard and will copy the code into the scripts section of an MCC account:
Instructions:
Towards the beginning of the script are lines that start with:
var spreadsheetUrl = "https://docs.google.com/spreadsheets/d/1Pkhl2QE...7LRzgXXJczCxr19aSGVUkMVkSZhiYMg/edit#gid=0";
And…
var sheetName = "Sheet1";
Be sure to add a link to your own Google Spreadsheet and add the name of the sheet (tab) where you want the dashboard to populate.
Contributing authors are invited to create content for Search Engine Land and are chosen for their expertise and contribution to the search community. Our contributors work under the oversight of the editorial staff and contributions are checked for quality and relevance to our readers. The opinions they express are their own.
Related stories
About the author