Chrome’s DevTools for SEO: 10 ways to use these browser features for your SEO audits
If you're conducting an SEO audit, you should probably be using DevTools in Google Chrome. Columnist Aleyda Solis shares 10 ways to use these tools to identify and fix SEO issues.
Although many of us in the industry pay hundreds or even thousands for SEO software that helps to automate and simplify our everyday work, we already have one of the most handy free SEO tool sets in the market with Google Chrome’s DevTools. Built into Google Chrome, this set of web authoring and debugging tools allows us to validate some of the most fundamental and critical SEO aspects of any page.
In most cases, using DevTools is pretty straightforward. But there are a few very handy and not so obvious applications for SEO analysis. Let’s go through them now.
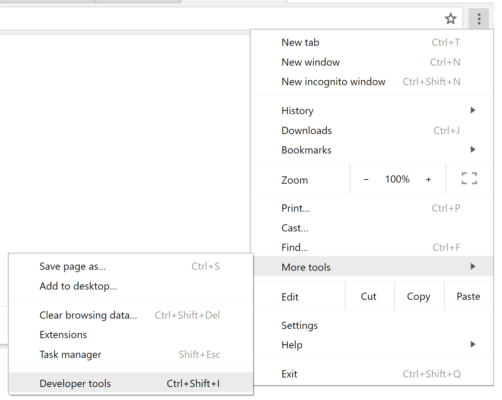
Start by navigating to the page you want to investigate in Google Chrome and opening DevTools. You can do this by selecting More Tools > Developer Tools from the Google Chrome menu in the upper right-hand corner of your browser window.
Alternatively, you can use the keyboard shortcuts Ctrl+Shift+I (Windows) or Cmd+Opt+I (Mac), or you can right-click on the page element you’d like to investigate and click “Inspect” from the drop-down menu that appears.
1. Check your page’s main content elements, including JavaScript-rendered ones
Google is now able to crawl and index JavaScript-based content, but it doesn’t always do so flawlessly. Therefore, it is a must to verify the main content elements of your pages — not only by reviewing their HTML source code, but also by checking their DOM to see how the information will be actually rendered and identified by Google.
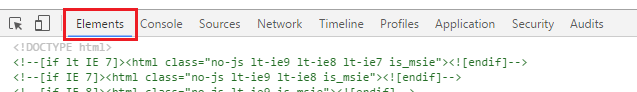
You can directly see the DOM of any page with DevTools in the “Elements” panel.
Use this to review the content of any of the page’s elements (such as the title, meta description or page text) to verify that the desired relevant information is shown in each case, to make sure it’s accessible to Google.
For example, in the upper left screen shot below, we can see how the displayed main text (in red) is included in a <div>. But this is actually implemented with JavaScript, the code for which can be seen in the upper right screen shot below, which shows the page’s HTML source code.
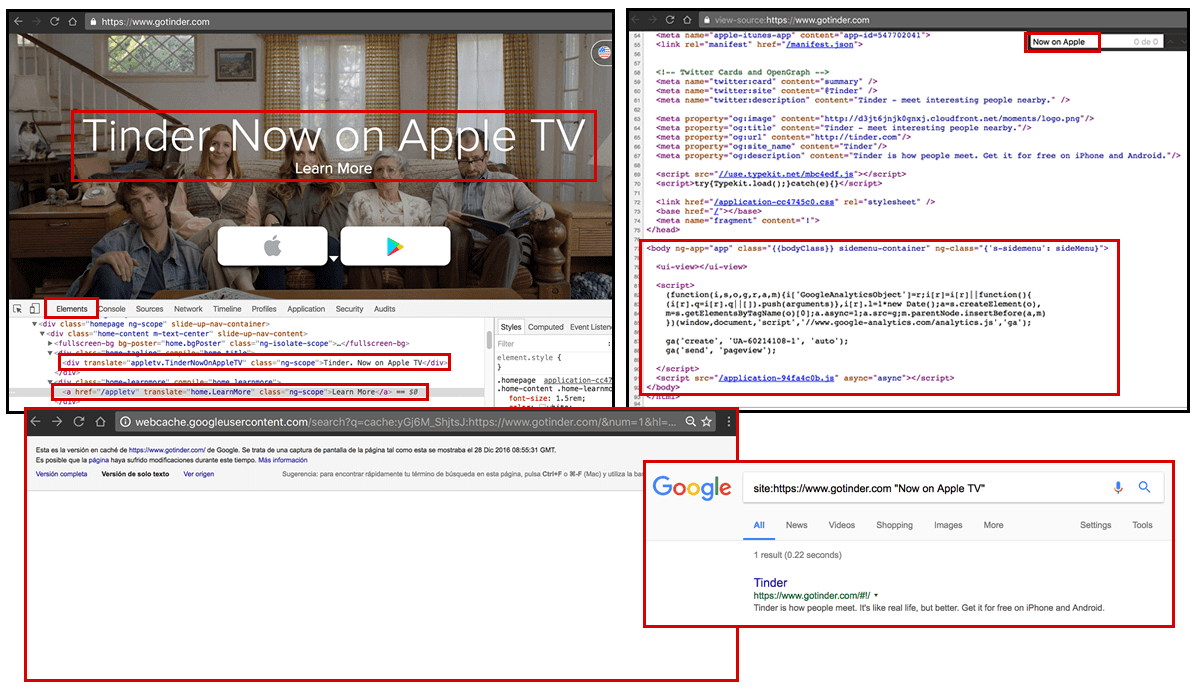
[Click to enlarge]
2. Look for CSS hidden content
It’s known that Google “discounts” text content that, although included in the page’s HTML source code, is hidden to the user by default with tabs or menu options that need to be “clicked” to view or expand them.
Among the most common ways to hide text is by using CSS with the “display:none” or “visibility:hidden” properties, so it’s recommended to check if there’s any important information on your site pages that might be hidden via these means.
You can do this with Chrome’s DevTools “Search” drawer, which you can access by hitting Ctrl + Shift + F (Windows) or Cmd + Opt + F (Mac) when DevTools is open. This search feature will allow you to look not only through the opened page file itself but across all of the used resources, including CSS and JavaScript.
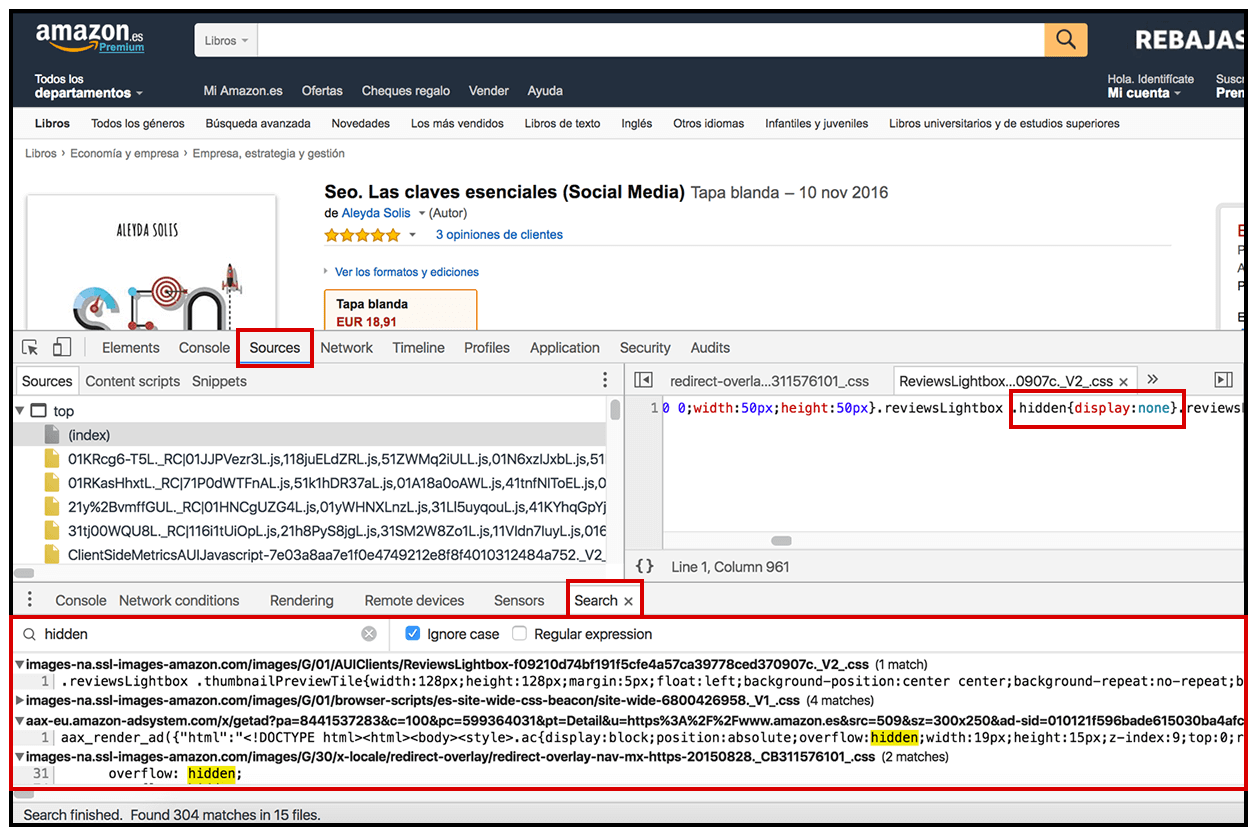
Here, you can search for the desired properties, in this case “hidden” or “display:none” to identify if/where they exist within the page code.
Click on a search result to view the full code surrounding the property you’ve searched for. Review the code to see which text is being hidden; if it’s important content, check if it’s being discounted by Google, and take the appropriate actions.
3. Verify your images ALT descriptions
Besides checking your pages’ main text content elements, you can also verify your images ALT descriptions in the “Elements” panel. Right-click on any image and select “Inspect,” as shown here:
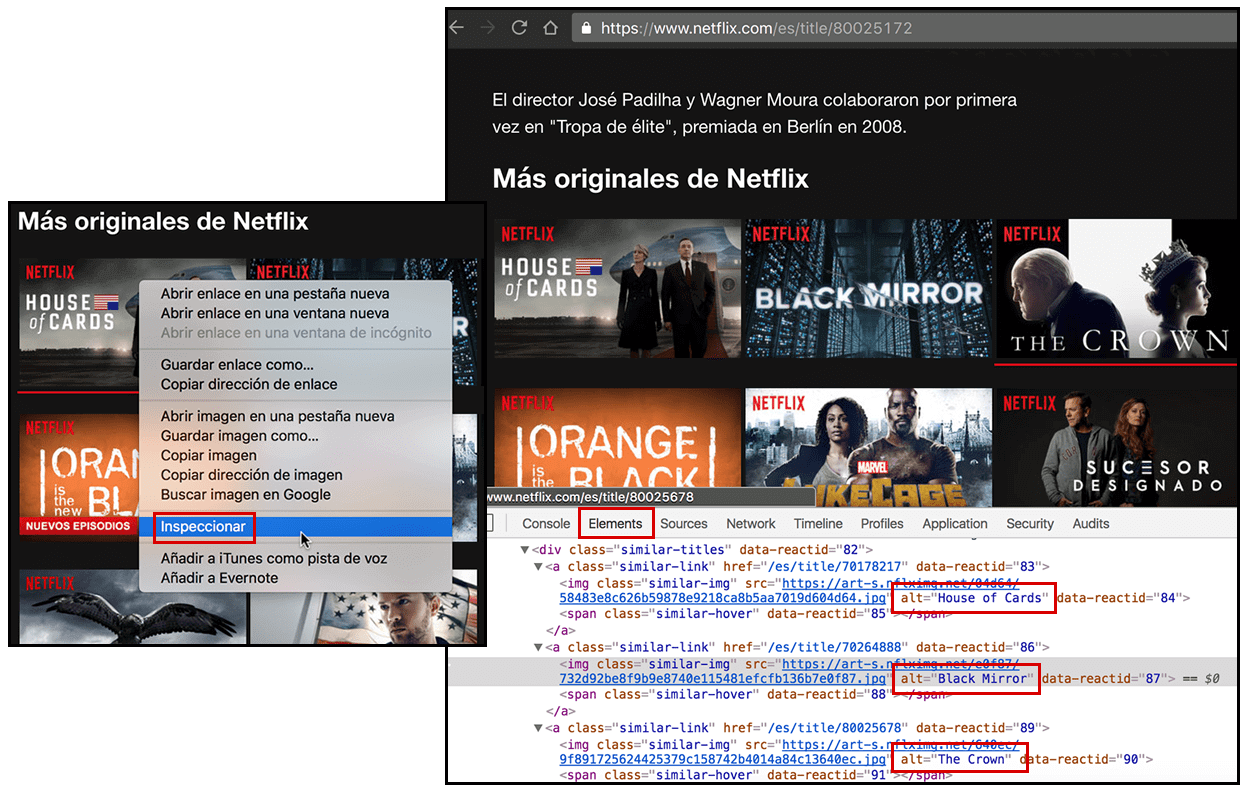
[Click to enlarge]
4. Identify no-indexation & canonicalization configuration in pages & resources
You can also use Chrome’s DevTools to inspect your pages’ technical configuration. For example, you can validate the meta robots and canonical tags configuration, which can be done by using the “Search” drawer to look for these specific tags and review how they’re implemented.
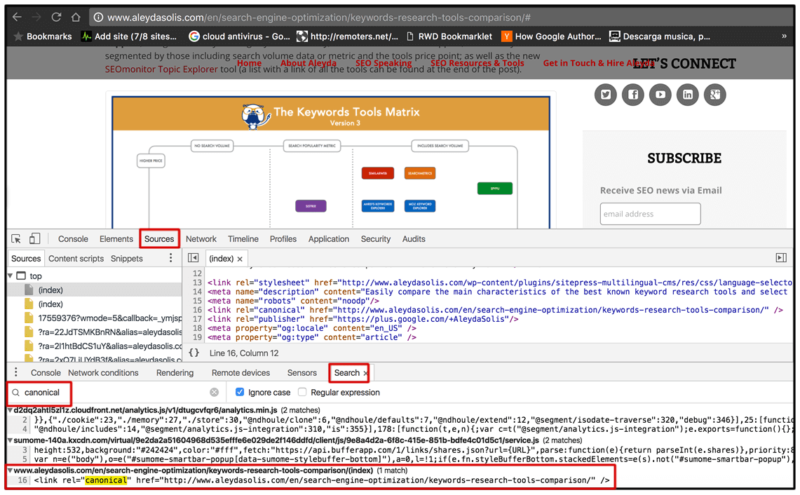
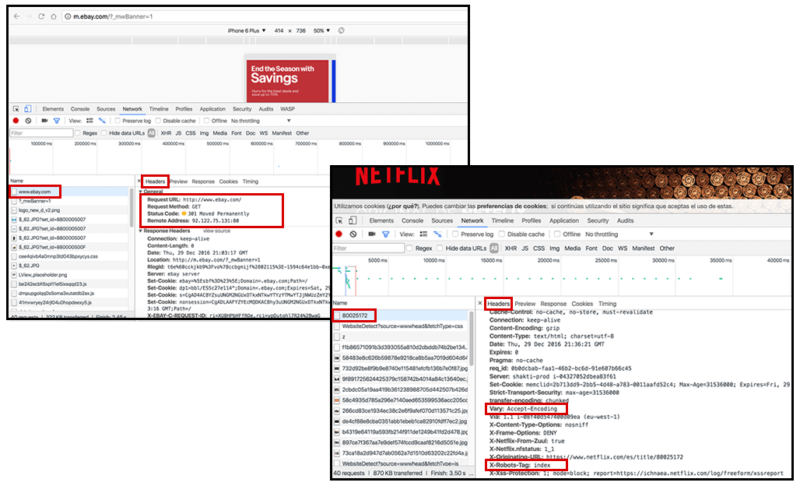
This validation can be done not only for the implementation of these tags in the HTML <head> area, but also in the HTTP headers, by going to the “Network” panel and selecting the desired page or resource to verify their header information, including the existence of a link rel=”canonical” in an image file, for example, as shown below.
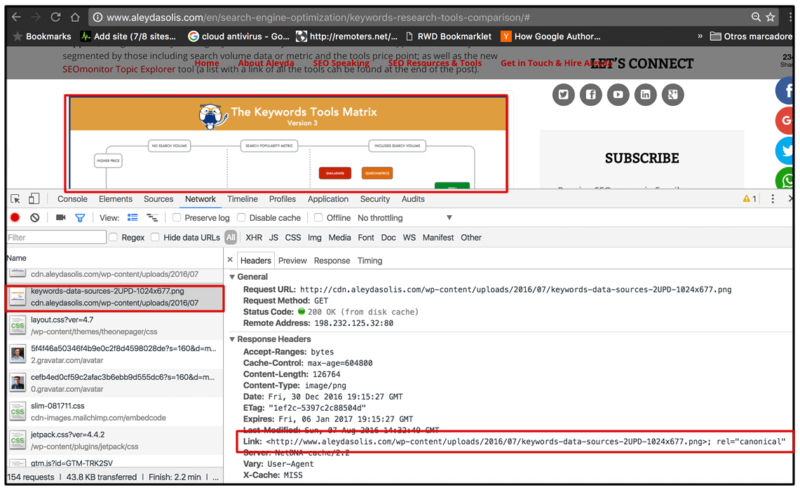
5. Look for the HTTP status in the header configuration
When checking the header configuration of the pages and resources using the “Network” panel, you can also verify their HTTP status and see if there are any redirects, which type of redirects they are, and error statuses, as well as the inclusion of other configurations such as the x-robots-tag, hreflang or the “vary: user agent” ones.
6. Validate your mobile web optimization by emulating any device
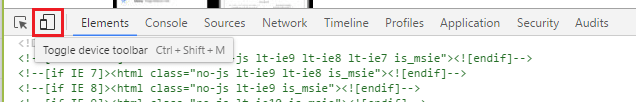
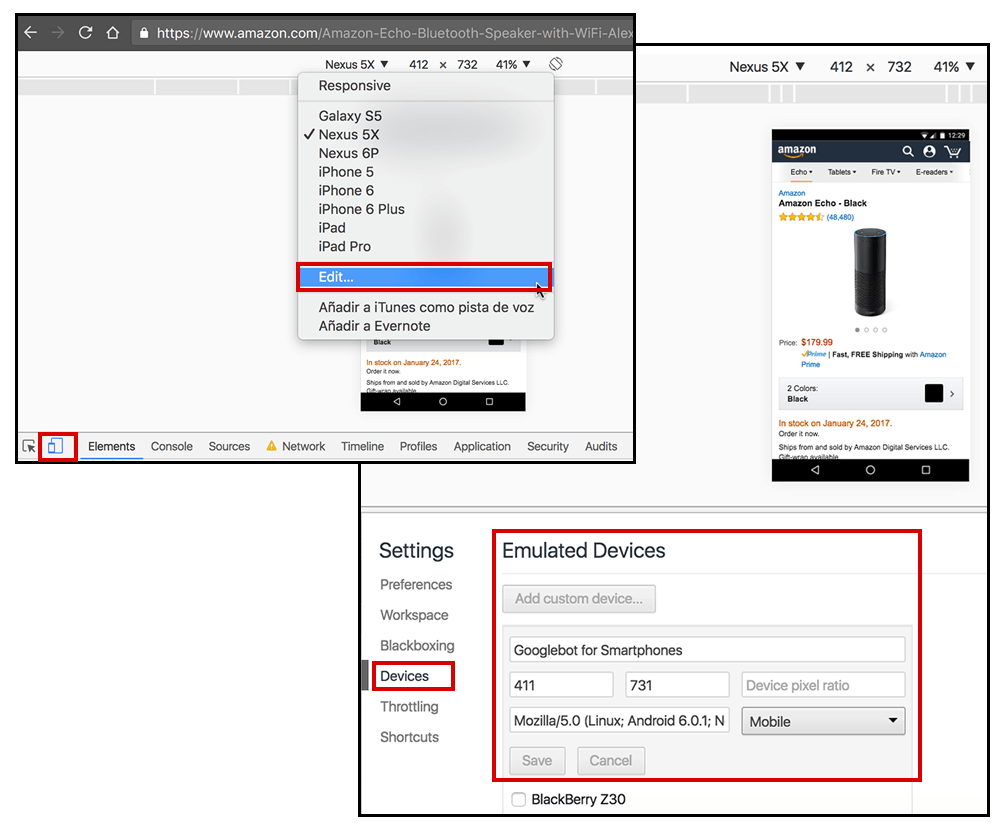
Mobile-friendliness is now essential for SEO, and you can validate page configuration and content in mobile using the DevTools “Device Mode.” This option can be enabled by clicking the device icon in the upper left-hand area of the panel or by pressing Command+Shift+M (Mac) or Ctrl+Shift+M (Windows, Linux) while the DevTools panel is open.
Once in Device Mode, you will be shown viewport controls in the upper area of the window. Here, you can select a responsive viewport (freely resizable) or choose a specific device to test your page with. You can also add your own custom device using the “Edit…” option.
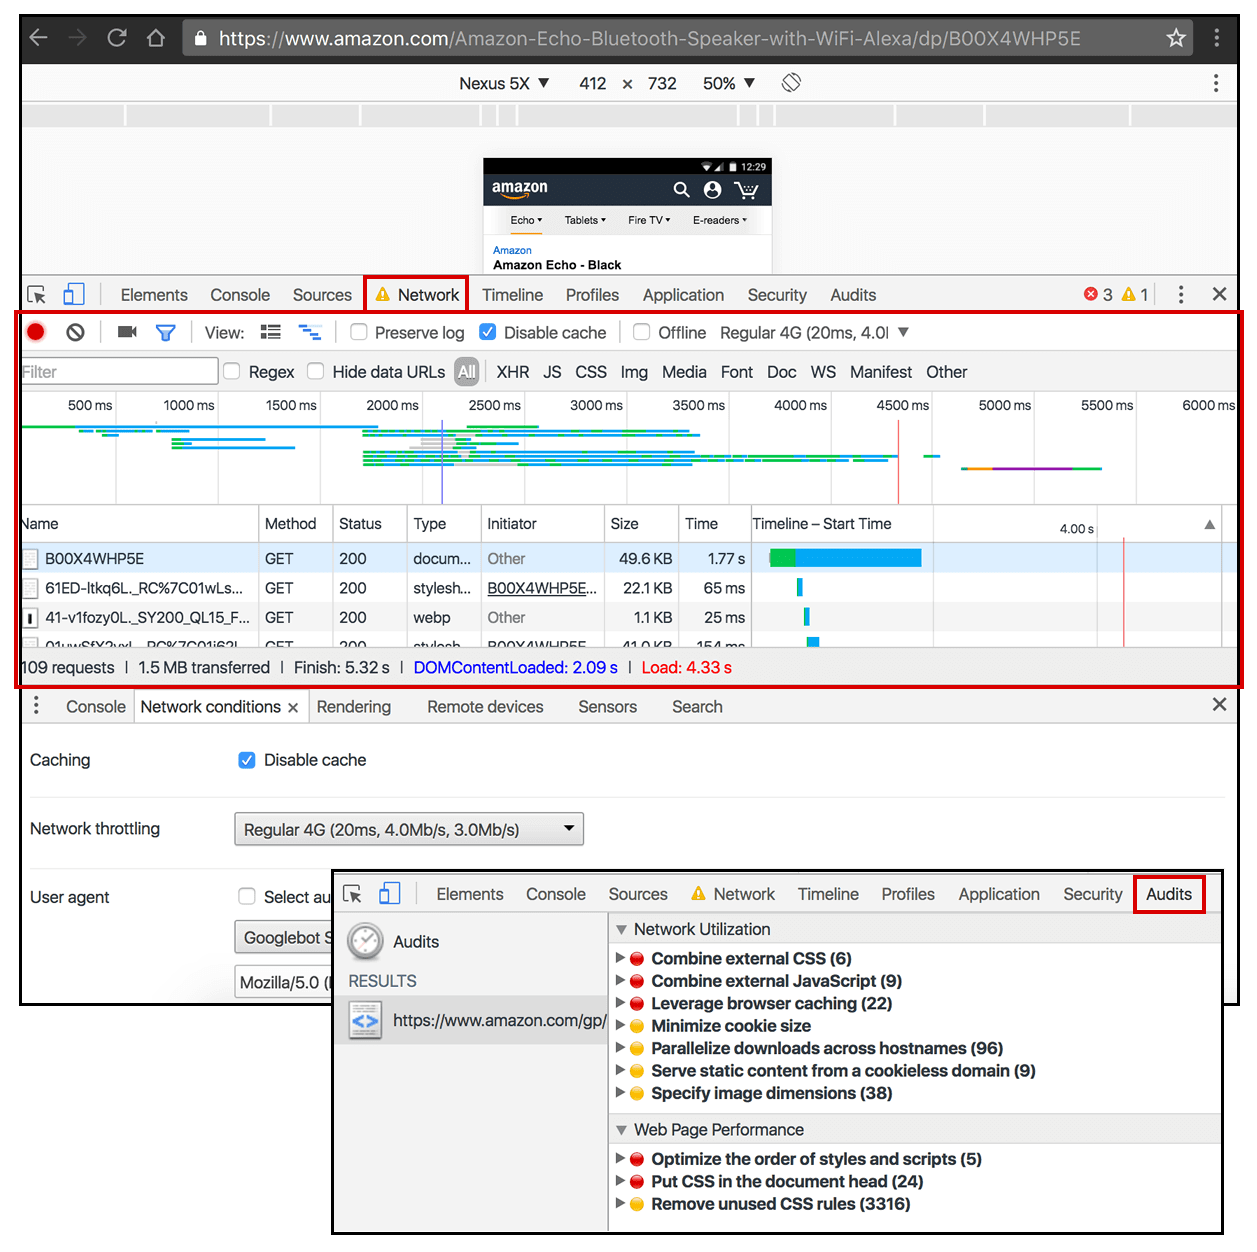
7. Assess your page load time & identify speed issues
Analyze any page load time by emulating the network conditions and device used. For this, you can go to the “Network Conditions” tool, which you can access from the Customization menu in the upper right-hand corner of the panel under “More tools.”
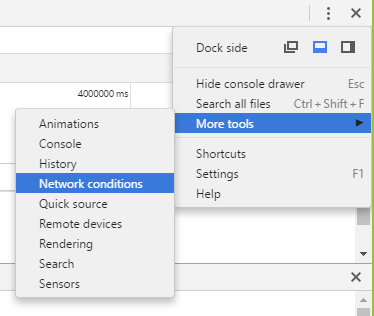
Here you will find the “Caching,” “Network throttling” and “User agent” configurations.

Once you’ve chosen your settings, you can reload the desired page and go to the “Network” panel to see not only the page’s full load time (Load) but also when the initial markup of the page has been parsed (DOMContentLoaded), both of which appear at the bottom of the window. You can also view the load times and sizes of each one of the used resources, which can be recorded by clicking on the red button at the left side of the panel.
To get recommendations of actions to take in order to improve the page speed performance, navigate to the “Audits” panel and click the “Run” button. Each recommendation will specify the related resources causing issues, as can be seen below:
Additionally, you can capture screen shots of your page rendering with the “Filmstrip” option. By clicking on the camera icon and reloading the page, you can view screen shots of your page across various stages of loading, which allows you to verify what your users can see at every stage.

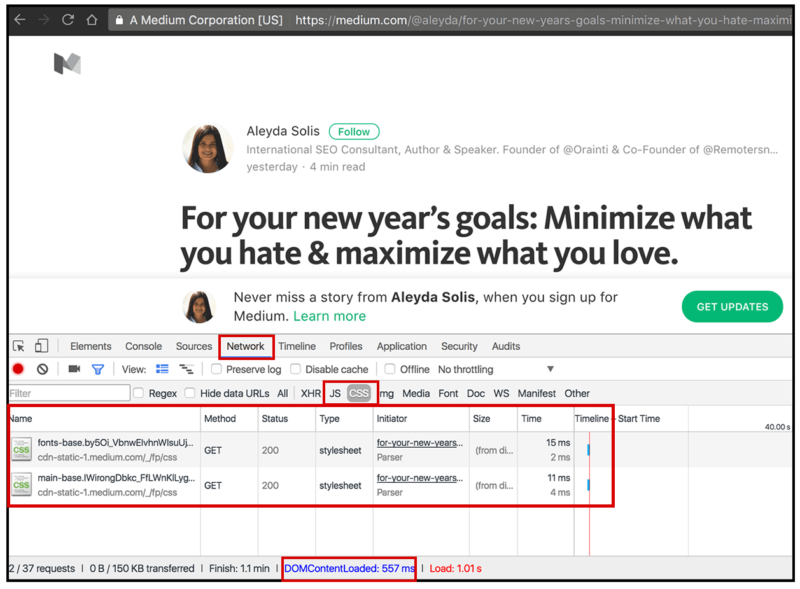
8. Identify render-blocking resources
You can also use the resources load times data in the “Network” panel to identify which JS and CSS resources are loading before the DOM and potentially blocking it, which is one of the most common page speed issues. You can filter by CSS and JS by clicking the buttons for them (as shown below).
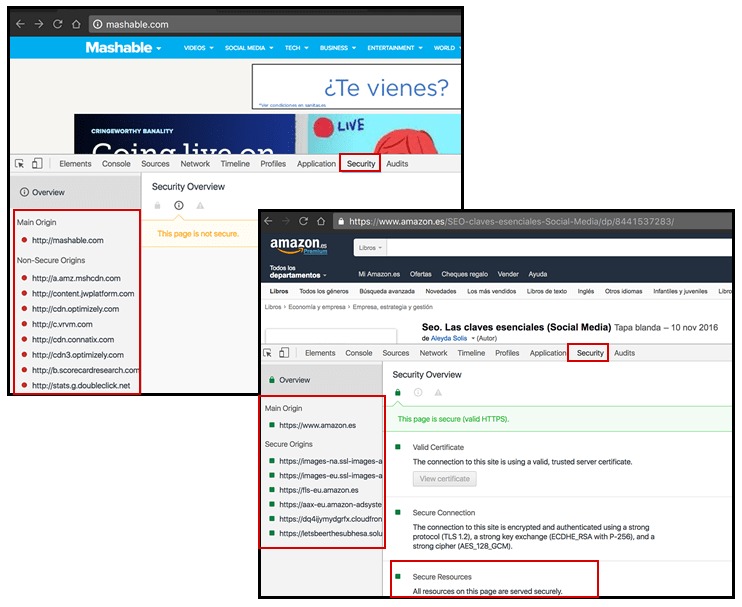
9. Look for non-secure resources during HTTPS migrations
Chrome DevTools can be very helpful during HTTPS migrations, as it allows you to identify security issues in any page with the information provided in the “Security” panel. You can see if the page is secure and has a valid HTTPS certificate, the type of secure connection, and if there are mixed content issues due to non-secure origins of any used resource.
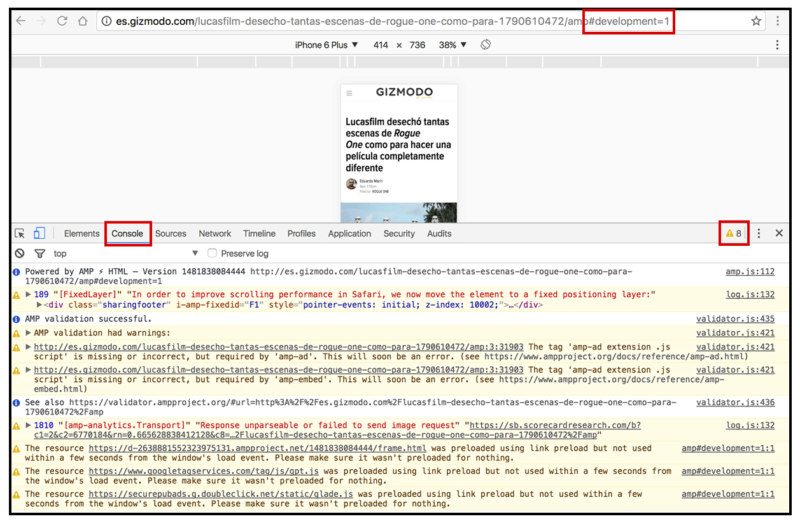
10. Validate your Accelerated Mobile Pages (AMP) implementation
If you’re implementing AMP, you can see if there are any issues with your pages by adding “#development=1” string to your AMP URL, then checking in the “Console” panel. This will tell you if there are any issues, warnings or errors — and in which element and line of code these have been found so you can take the appropriate action to fix them.
Bonus: Personalize Chrome DevTools settings
As you can see, you can use Chrome DevTools for SEO in so many ways that you will likely spend some time in it. Thus, you might want to personalize it a bit based on your own preferences. You can adjust the appearance, enable shortcuts and more.
You can do this in the “Preferences” settings, which can be found by clicking on the Customization menu button in the upper right-hand corner of the panel and choosing the “Settings” option.

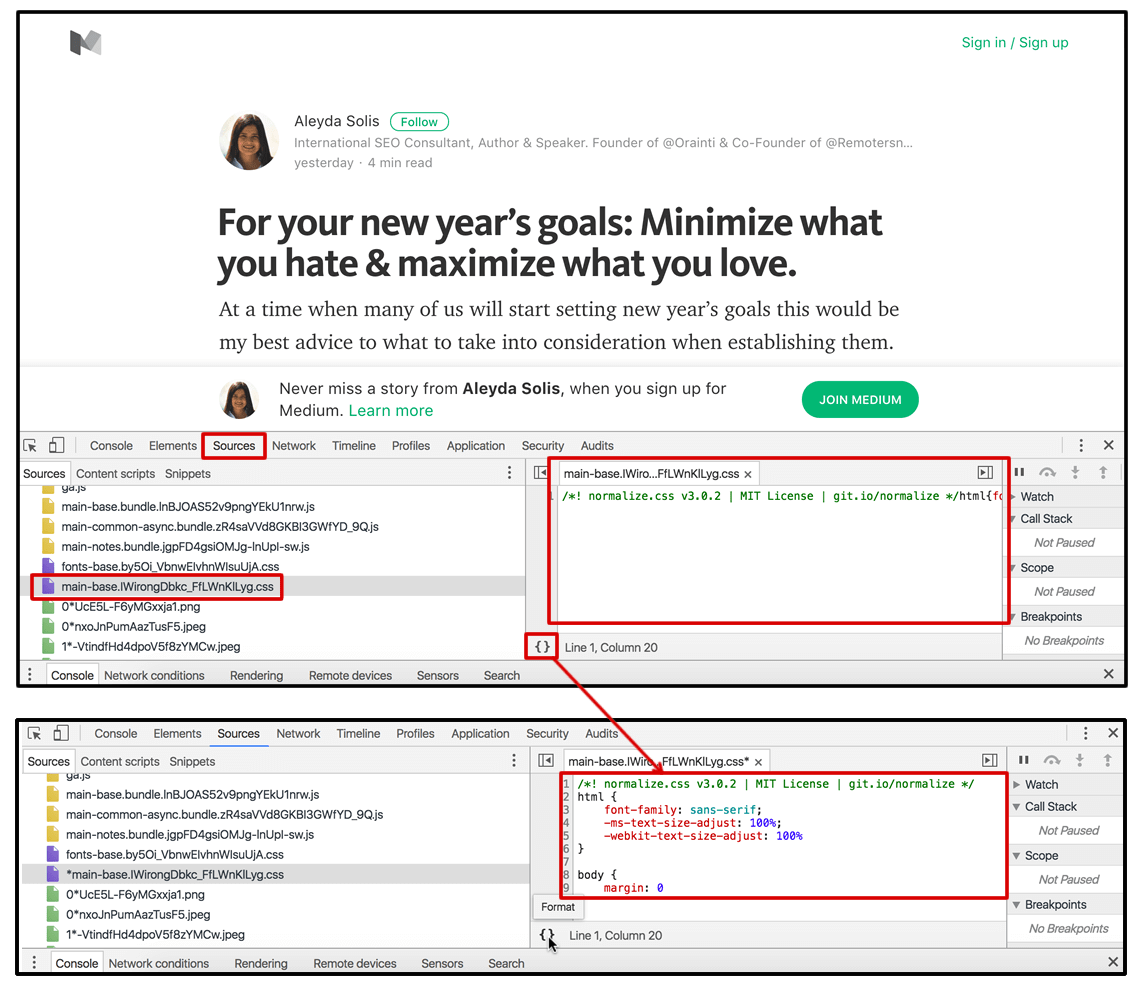
Last but not least, speaking of personalization of preferences: Analyzing minified code can make it difficult to parse, so make sure to click on the pretty print “{}” button in the central bottom area of the panel so you’re able to see a non-minified version. This will allow you to go through it easily due with improved readability.
I hope these Chrome DevTools tips help to make your SEO life easier!
Contributing authors are invited to create content for Search Engine Land and are chosen for their expertise and contribution to the search community. Our contributors work under the oversight of the editorial staff and contributions are checked for quality and relevance to our readers. The opinions they express are their own.
Related stories
New on Search Engine Land
About the author