Excelling (Again) At Excel For Search Engine Marketers
On Thursday, March 13th, I will be presenting on the Extreme Excel Excellence panel at SMX West with John Gagnon and Brett Snyder (moderated by Chris Sherman). In the session, we will be delivering power-user tips for marketers using Excel, and Chris has raised the bar very high for us to deliver truly advanced-to expert-level hacks on what […]
On Thursday, March 13th, I will be presenting on the Extreme Excel Excellence panel at SMX West with John Gagnon and Brett Snyder (moderated by Chris Sherman). In the session, we will be delivering power-user tips for marketers using Excel, and Chris has raised the bar very high for us to deliver truly advanced-to expert-level hacks on what has become the most commonly used software platform in the digital marketing industry.
In my time here at Search Engine Land (this will be my 148th post), I’ve written about best practices, innovative technology and the business of paid search. However, the series of articles from which I have by far received the most reader feedback have been the pieces I wrote in 2009 regarding Excel for SEM Applications:
Excel For SEM Applications Mini-Guide
- Part 1 – Conditional formatting, Concatenation, Length Formula
- Part 2 – Select only visible cells, Macros, Create a Table of Contents, Set Print Area
- Part 3 – More Excel resources, Paste Special window, Protecting sheets, Custom Lists, VLookup
- Part 4 – General Excel efficiency tips, Named ranges, Secondary Chart Axis, Tab colors, Go to the next line in a cell, Print Headers on Every Page, Count days between days, Turn off hyperlinks, Excel shortcuts Cheat Sheet download
- Part 5 – Master Pivot Tables
- Part 6 – Recap of series, Excel user levels, The Online Marketer’s Excel Skills Test
Check out those previous columns for some great Excel tips, especially Part 5 on Pivot Tables which seemed to be the most popular post. Below are some more quick Excel tips for you:
Persistent Format Painter
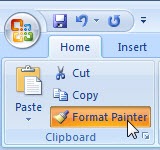
Most people know the Format Painter tool. You can highlight any text, click that button and then “paint” the formatting of that text on to other text. By default, after you paint something, the button resets so you can continue working and not have to turn it off. But, what if you have more text to paint? It can be a pain to keep having to highlight the source text if you are painting multiple selections.
You may not know (and thanks to Sara Rennich for this one) that you can double click the Format Painter so it stays “pushed down” so that you can paint as much as you want without having to keep selecting and clicking. When you’re done, click the button once, and it will turn off.
Get A List Of Pivot Table Formulas
Pivot Tables are one of the most important features of Excel for search engine marketers. You can slice and dice the data in order to find those great little nuggets of insight you need. Many times, you’ll need to create calculated fields in order to display ratio metrics such as cost-per-click (cost/clicks), click-through rate (Clicks/Impressions), etc.
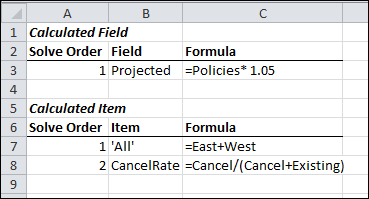
However, sometimes you have so many calculated fields that you might forget (or want to check) what they are. On the Pivot Table -> Options ribbon, click Fields, Items, & Sets and then select List Formulas. Excel will automatically create a new sheet in your workbook and list each Calculated Field and its formula. (Thanks to Laura Ruszkowski for this one!)
Improve Your Pivot Tables With Slicers
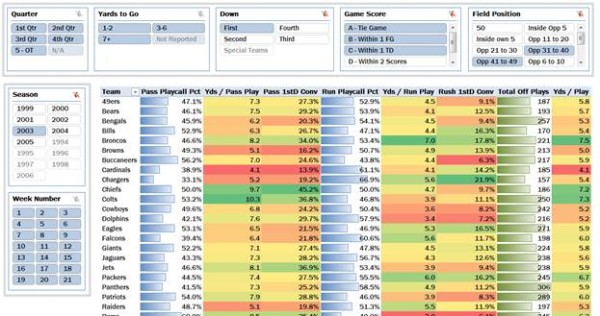
You now have the option to use slicers to filter pivot table data. These controls allow for quick filtering and have the added benefit of also showing what filters are currently active. This makes it easy to understand exactly what data is being displayed.
I find slicers are really valuable when sharing pivot tables with others so that they can easily take control of the data without worrying about accidentally changing anything that could mess up the report.
When You Don’t Need A Big Chart, Use Sparklines
Sparklines are very small charts without axes, coordinates, or legends. They’re meant to provide a brief visualization of simple data when you don’t need a fully blown-out chart. I find that they’re very helpful at the end of rows or columns to quickly compare data over a range. For example, if you are looking at a month-over-month table, you can drop some Sparklines in to visually see the spikes and dips of that metric throughout the year.
Sparklines can be found in the Insert ribbon and you can choose from either Line, Chart, or Win/Loss types. You choose the range of data and then which cell or cells you want to embed the sparkline. Although tiny, they’re very powerful and Excel provides some pretty cool customizable options in the Sparkline Tools menu if you select one.

Keep Your Eyes On The Prize With Watch Windows
Watch Windows let you select cells to add to a small window that will stay on top of your screen while you are in Excel, even if you switch between sheets in a workbook. This way you can monitor those cells from one spot without having to keep flipping between sheets while you work.
Watch Windows can be very helpful when you’re working in large workbooks with charts that are linked together with cells that change when new values are added to other cells. For example, you may be working on next year’s budget and want to keep an eye on total spend for your campaigns as you add and remove money from various aspects of your search program.

Goal Seek
Found in the Data ribbon under the What if Analysis menu, Goal Seek can be a very helpful tool in situations where you know the result that you want from a formula, but you are not sure what input value the formula requires to get that result. That may sound a bit confusing, but let me illustrate it with an example.
Let’s say you want to reach $1,000,000 in revenue. You want to figure out how much that’s going to cost you. You know your average CPC is $0.43, your average conversion rate is 1.87%, and your average order value is $96.22. For purposes of this example, it may seem like a relatively easy calculation to do manually, but just imagine if this problem was much more complex with much bigger numbers and even more fields to consider.
After filling in my table with the known data and setting up the formulas properly, you get to this point:
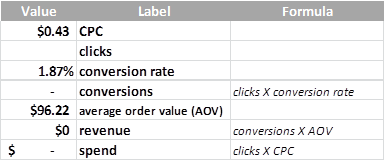
By using Goal Seek, you can specify that the million dollars in revenue is the goal with the number of clicks being the linch pin to figuring out how much it would cost to hit that revenue goal.

Goal Seek figures out that you would need 555,767 clicks to hit that revenue with a spend of $238,979.97.

You can do some really cool stuff with Goal Seek and it’s a function that many power Excel users have never even heard of.
Power Pivot
I’m sure many of you have experienced the dreaded “Excel freeze” when trying to manipulate big tables in Excel. As of 2012, Excel now offers Power Pivot to not only help solve this common problem, but also to provide deeper business intelligence (BI) capabilities that turn the application into a very powerful analytics tool.
Power Pivot also allows you to import millions of rows of data from multiple data sources into a single Excel workbook. The real advantage is the speed. Because the data tables live outside of Excel, filtering and pivoting big files feels like you’re working with a twenty-row table.
You do have to install Power Pivot but the implementation doesn’t take much time nor is it very complicated. Once you have it going, you will also benefit from Data Analysis Expressions (DAX), a new formula language that really shows off the power in Power Pivots. It enables more sophisticated and complex grouping, calculation, and analysis and the good thing is that it is very similar to that of Excel formulas.
If you really want to unlock the full processing power of Excel, you have to use Power Pivot.
Contributing authors are invited to create content for Search Engine Land and are chosen for their expertise and contribution to the search community. Our contributors work under the oversight of the editorial staff and contributions are checked for quality and relevance to our readers. The opinions they express are their own.
Related stories
New on Search Engine Land
About the author