Getting started with Google Search Console
In this first part of our in-depth exploration of the new Google Search Console, we'll explain the overview section, Performance report and URL inspector.
 This is the first part of an in-depth series exploring the new Google Search Console interface and all of the functionality to be found therein. We’ll start with an overview and will proceed by exploring all of the sections of the tool. Once we’re done, we’ll update the resource regularly whenever new features are added.
Google Search Console (GSC) is among the most important services that Google provides to SEO practitioners and developers alike. There’s click, impression, and search query information for SEOs, and developers can access vital information to help troubleshoot or discover potential undetected indexing problems. Data appears in the GSC account once site ownership has been verified, some of which can then also be made available to Google Analytics.
Overview
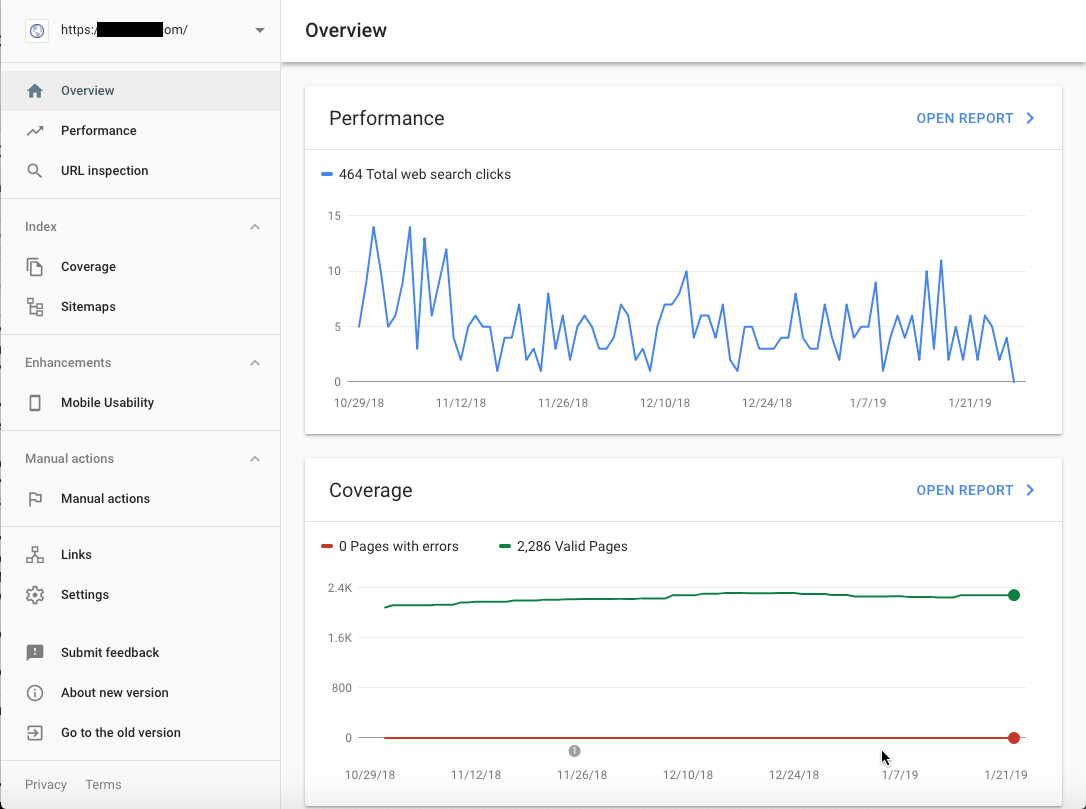
GSC opens to an overview of primary subsections: Performance, Coverage and Enhancements. This is useful for viewing click trends and defaults to a sensible, recent date range. Links to reports for each section will open individually.
Configure a custom date range to span 16-months of clicks by opening the Performance report for more controls. Coverage shows indexing. Enhancements show Mobile Usability details, and will include AMP and Schema entities when detected. There’s also a new URL inspection tool.
The Performance report
Most SEO practitioners will want to examine data scoped out for making strategic decisions. When you open the Performance report, you’ll find controls for that context — controls to define site data that animate charts in real time.
Alter criteria and your chart will snap to the state of your settings. Use this to your advantage to analyze your search performance and learn the finer details about how Google accumulates click, impression, and position data.

Default is Web search data over the last 3-months
The resulting chart animates to changed settings in real-time
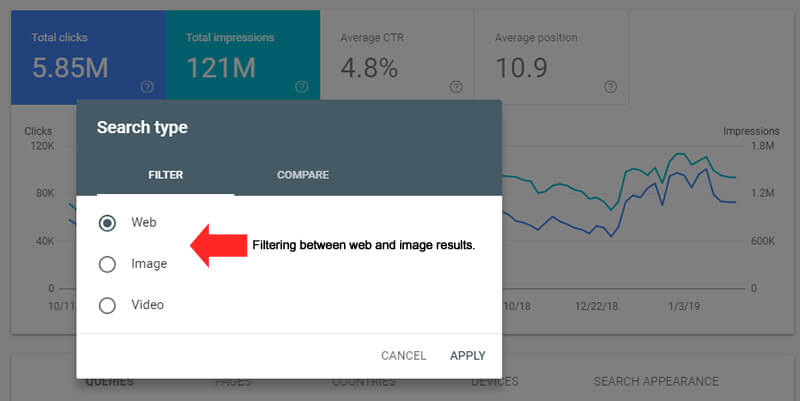
Start by choosing Search data type
Start by choosing your search data type and the date range that suits your immediate needs. Find the custom date range that can span across 1-year for charting and 16-months for the data table. On at least one occasion selecting old dates I experienced Google “preparing” the data and was told to “check back in a few days.” After choosing your starting data set, you can further refine it to hone in on specific areas of concern.
Click the “+ New” button for options that include: Query, Page, Country, Device, and Search appearance. Each of these filters has familiar match-type interfaces: broad, negative and exact using the language “containing,” “not containing,” and “is exactly.”

Choose a filter type to further refine data

Match options for filters or compare 2 exact match filters

Comparing traffic source by source country of origin
Each filter also allows you to compare two exact match values. Very busy charts that might result can be fixed by instantly redrawing via altering criteria. Four convenient toggle switches control your line charts for Clicks, Impressions, CTR, and Position.
Try a new filter and edit or remove filters when you decide to analyze something differently. The new interface is a joy to use for determining the relative value of keywords, sections of your site, traffic source by country, the type of devices searchers are using, and how Google is serving your pages.

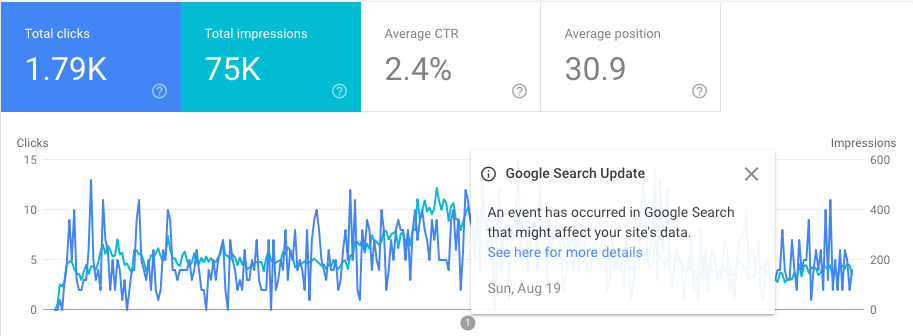
The x-axis is always your trend line by date. The y-axis values default to Clicks on the left, Impressions to the right. The ‘Total clicks” blue panel and ‘Total impressions” teal one double as toggle switches, as do “Average CTR” and “Average position.”
With these toggles, you can get all four line graphs going at once, but you will need to hover over the chart for values when more than two line graphs are visible. Notice the message icon on the x-axis which loads a tooltip on hover and a corresponding info panel on click.

The way to work with your Performance report criteria can be very similar to how a search practitioner would work in Google itself. You should be familiar with advanced search syntax to refine Google SERPs to your site, perhaps combined with keywords or words in URLs that match categories or products.
Perform the same kinds of actions in GSC to analyze sections of your site using Query and Page filters. For example, provided your site has the architecture for it, the Page filter can be utilized to refine data to directories that map to your categories and products.
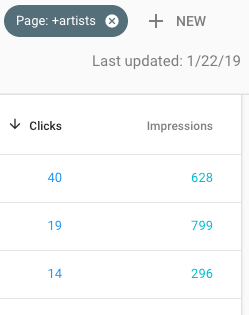
Page filter to artists subdirectory index
Line charts are great for analyzing trends, which are, in turn, useful for understanding milestones and the effects of particular events. But you may want to refine data into smaller buckets for more detail.
The tabbed data table below the line chart has a secondary set of filters for you to munge data that’s expressed in columns and rows. In some cases, the secondary filter controls have different match types than master filters above — such as “greater than” or “smaller than” filters. It is here you can filter Average CTR and Average position numbers.
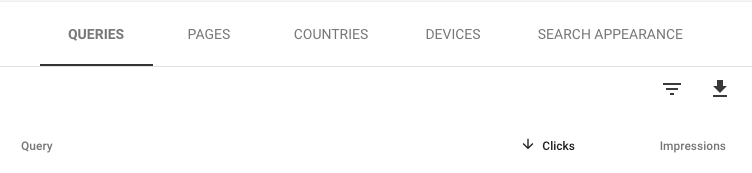
Tabs for the data table view

Filter options which can add columns
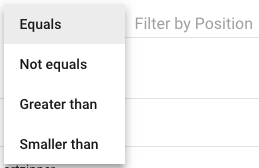
Data table filter match options
The URL inspection tool
As granular as these filters can get, the URL inspection tool is the best resource for page-level detail. Enter a full path URL into the inspection tool’s input field and be treated to page-specific details for indexing and crawl findings, including the site’s availability to Google search users and a link to request indexing when the page is not yet available.
Click the “View Crawled Page” link to open further tab detail panels for HTML, Screenshot, and More Info. More Info is especially useful with a full HTTP response record and Page resources information. You might find room for improvement here, such as identifying style or script resources that can be combined.

View Crawled Page More Info panel (opens on the right in wider viewports)
A typical page with modern design can require many external resources in order for a browser to render the page as intended, including styles and scripts. If these can be combined into a single source, the number of requests required to assemble a page drops accordingly.
Modern tooling allows for automation of this in various technology scenarios; however, these same scenarios exacerbate the numerous external resources problem today compared with the quaint table layout days of the past. It’s now the norm to combine and minimize (compress) styles and scripts.

GSC shows information you can use for troubleshooting. Here is an example where Page resources aren’t loading. Details for these identify them as images. That’s by design for this site. Original images for this site are protected from hot linking and simple theft. It makes sense Google can’t retrieve protected images without an authorized path to those resource URLs.
After making an arrangement to allow Google to fetch protected image resources I discovered an actual issue where the Test Live URL feature behaves differently than the main inspection report derived from passive crawling. Relative paths to assets, including styles, will fail. The Test Live URL feature requires absolute paths to your resources which is a best practice for SEO in any case.
It might be alarming to see something like this in your GSC reports. Be prepared to interpret the data to others, depending on your role in your organization.
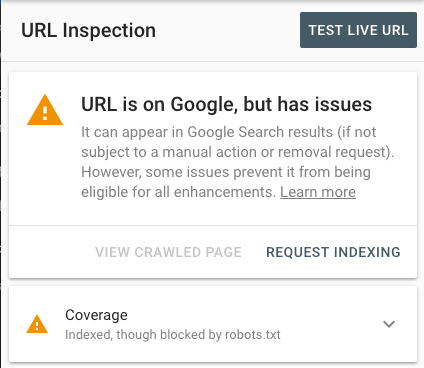
Here is an example of information where a page is in the Google search index and blocked by Robots Exclusion. I would like to see a link from the URL inspection report to request removal as well as indexing when the URL in question appears in a site owner’s Robots Exclusion. It’s usually by design a site owner wants a page excluded.
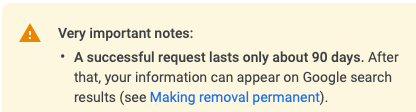
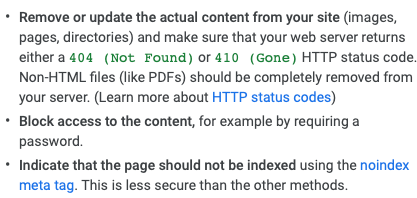
The removal request procedure is unfortunately only temporary (90-days) during which time you’re going to want to handle the arduous task of setting up such URL(s) to respond with status 404 or 410 for permanence.
The future of the new Google Search Console
Some reports that SEO developers relied on for troubleshooting from the old GSC version webmaster tools will either be reestablished in the new URL inspection tool, appear in the Coverage report, or may actually be removed completely. These include HTML Improvements, Crawl Errors, Fetch as Google, and more.

It seems likely that Google expects similar information can be obtained by using your database console, by shell scripting, or with third-party crawl tools, but the company continues to add functionality to the new console as the date for the old version’s sunsetting approaches.
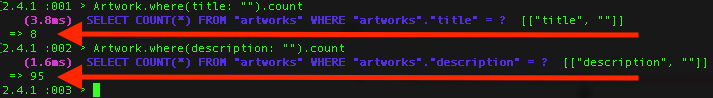
Database Console with ActiveRecord (Ruby) and SQL Statements Counting Empty Titles, Descriptions
In our next installment, we’ll explore the Index section of Google Search Console, where you can learn about your pages’ standing in the Index as well as submit sitemaps.
Contributing authors are invited to create content for Search Engine Land and are chosen for their expertise and contribution to the search community. Our contributors work under the oversight of the editorial staff and contributions are checked for quality and relevance to our readers. The opinions they express are their own.
Related stories
About the author