New chart annotations make Google Ads’ change history reports much easier to navigate
Annotations are available in campaign-level change reports in the Google Ads UI.
Google added annotation cards in change history reports in the Google Ads UI on Wednesday. There are also new sections for
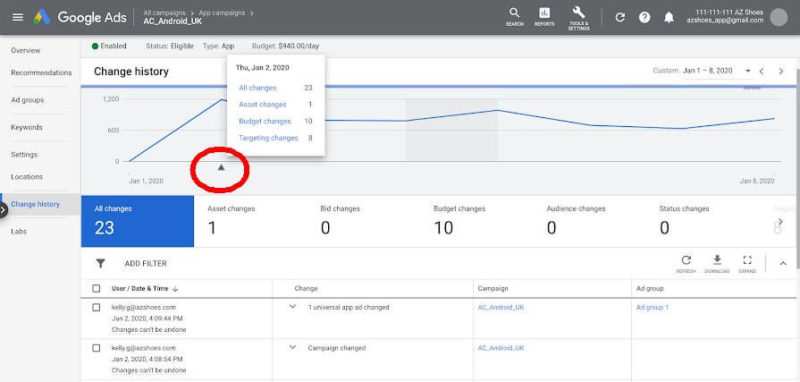
Using annotations. You’ll see a little triangle icon below the change history performance chart indicating an annotation. Click on the triangle to open a card that lists and links to the types of changes made during that time period.
Clicking on any of the links will take you to that section of the change history report. For example, clicking on “Budget changes” will highlight that section of the report and show the 10 changes made.
Why we care. This a pretty handy update that can help you identify and navigate to the changes that might have impacted your performance faster.
Google will also show audience list, optimization goal and asset (for App campaigns) in the list below as well, when applicable
Contributing authors are invited to create content for Search Engine Land and are chosen for their expertise and contribution to the search community. Our contributors work under the oversight of the editorial staff and contributions are checked for quality and relevance to our readers. The opinions they express are their own.
Related stories
New on Search Engine Land
About the author