Pricing vs. ad spend: Which drives more Amazon sales?
Learn how pricing and ad spend influence Amazon sales and gain insights into optimizing your own Amazon performance.
The Amazon marketplace makes it easier than ever to scale an ecommerce business.
While long-term sales growth can come from optimizing listings and expanding keyword targeting, sellers have two primary short-term levers:
- Pricing.
- Ad spend.
This article explores how changes to these factors impact Amazon sales performance.
TL;DR
- Price and ad spend are the two levers sellers can use to influence sales in the short term.
- We analyzed trends across five products. Both strongly influence sales, but ad spend appears to have a stronger relationship.
- This study’s application is limited, as we reviewed a small range of products in a specific category. However, it provides instructions on how to analyze your own product(s).
- This should be applied to specific product data for practical use cases.
In this study, we analyzed two years of sales data for five non-commodity gift products on Amazon, priced between $20–$60, with daily ad spend ranging from $0–$40.
By reviewing trends across these products, we aimed to identify which variable – price or ad spend – had a stronger impact on sales.
Our findings show that both variables correlate with sales volume, though ad spend appears to have a stronger influence.
Data compilation and manipulation
To streamline our data collection, we used:
- Sellerboard to export daily sales and ad spend per product.
- Helium10 to export daily prices.
The data sets were matched using VLOOKUPs, removing any days with zero sales, as these likely indicated stockouts.
With over 2,000 rows of data across five products, we created several new metrics based on existing ones to make the data more scalable and insightful. Below, we outline our process in detail.
Aggregated differential pricing
Our data set included five products, each with a different price point, so we needed a standardized way to compare pricing across them.
Instead of using actual prices, we focused on pricing changes by creating a metric called “differential pricing from the mean.”
First, we calculated each product’s average price, then subtracted each daily price from this average to determine the deviation from the mean.
These deviations, or “differential prices,” were then rounded into integers to group similar values, creating a consistent and comparable metric across all products.
For example, Product A had an average price of $33.90. If the actual price on a given day was $33.70, this represented a -$0.20 difference from the mean, which we rounded to 0, indicating the price was at the mean. Conversely, if the actual price was $33.00, there was a -$0.90 difference, which we rounded to -$1.
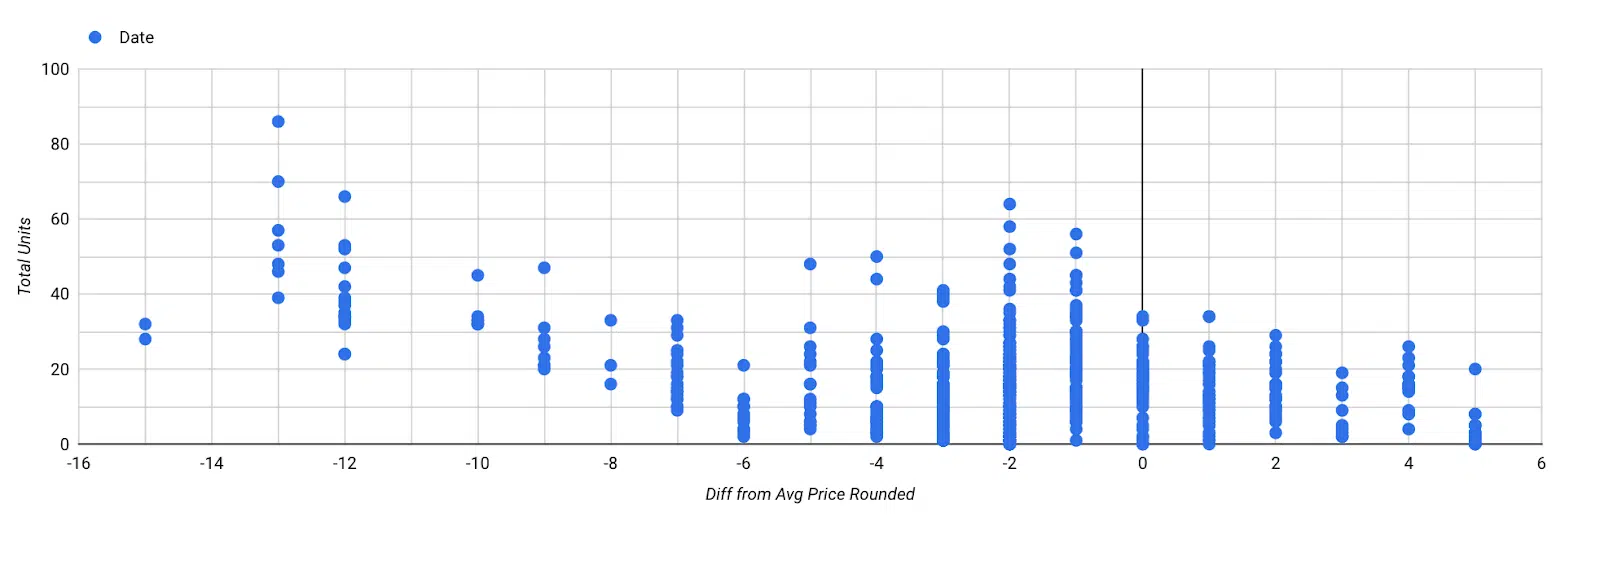
The screenshot below shows these pricing groups for Product A on the x-axis:
- 0 represents the mean price.
- +1 is for price points rounded to $1 above the average.
- -2 is for price points rounded to -$2 below the average.

In the next step of the graphing phase, we aggregated each pricing differential to calculate the average sales for each specific pricing differential. The results are displayed in the graph below.

In the example above, units sold are represented on the y-axis, and price differentials are on the x-axis.
Each blue dot is an aggregate of all the same price differentials and the average number of sales at that price differential.
For example, at -5 on the x-axis, we see all the days when a product sold for $5 less than its average price (35 instances of this). At this price differential, the average number of units sold was 4.89.
Aggregated ad spend
For daily ad spend, we also rounded each data point to the nearest integer (e.g., a daily ad spend of $23.65 was rounded to 24).
In the graphing stage, we aggregated identical daily ad spend amounts and plotted these against the corresponding average sales.

In the chart above, each x-axis point is an aggregate of all daily spends at that spend.
For example, the blue point at $40 on the x-axis represents all days where ad spend was $40 (in this case, six instances). We see at $40 the corresponding average sales of 8.5 units on those six days.
Pricing differentials at different ad spends
After making these manipulations, we can see that average ad spend is fairly consistent at all pricing differentials.
On the graph below, pricing differentials on the x-axis are spaced out evenly with ad spend aggregates on the y-axis.

We can be confident that our ad spend remained consistent across varying price points, ensuring we didn’t spend more when prices were low or less when they were high.
This balanced approach allows for a fair comparison of metrics across different price levels.
Findings: The impact of pricing on sales
So, how do changes in price affect the total units sold?
The chart below illustrates this relationship, with price differentials plotted along the x-axis and average sales on the y-axis.
The orange trend line indicates a general pattern:
- When prices fall below the mean (represented by 0 on the x-axis), we see an increase in sales.
- Conversely, when prices rise above the mean, sales tend to decrease.
Interestingly, this relationship is not as linear as anticipated. Average sales appear to stabilize within a range of -$5 to +$5.
We initially expected a more straightforward pattern, where sales would consistently decrease as prices increased.

Sales may be higher at price differentials below -7.5 due to increased ad spend rather than solely because of lower pricing.
In the graph below, we represent higher ad spend with larger bubbles. It shows that most of the highest sales points coincide with the largest ad spends.

Overall, lower pricing seems to drive more sales, but it’s not a steady trend, and ad spending could be a confounding factor.
Findings: The impact of ad spend on sales
In the chart below, ad spend is plotted on the x-axis and average sales on the y-axis.
A clear trend emerges: as ad spend increases, total units sold also rise.

We can also rule out cheaper pricing as the cause of increased sales. In the chart below, higher prices are represented by larger bubbles.
Surprisingly, some of the highest sales occur at the highest prices, which is the opposite of what we initially expected.

Overall, there seems to be a strong trend between ad spend and sales and pricing appears to have little effect.
All three variables together
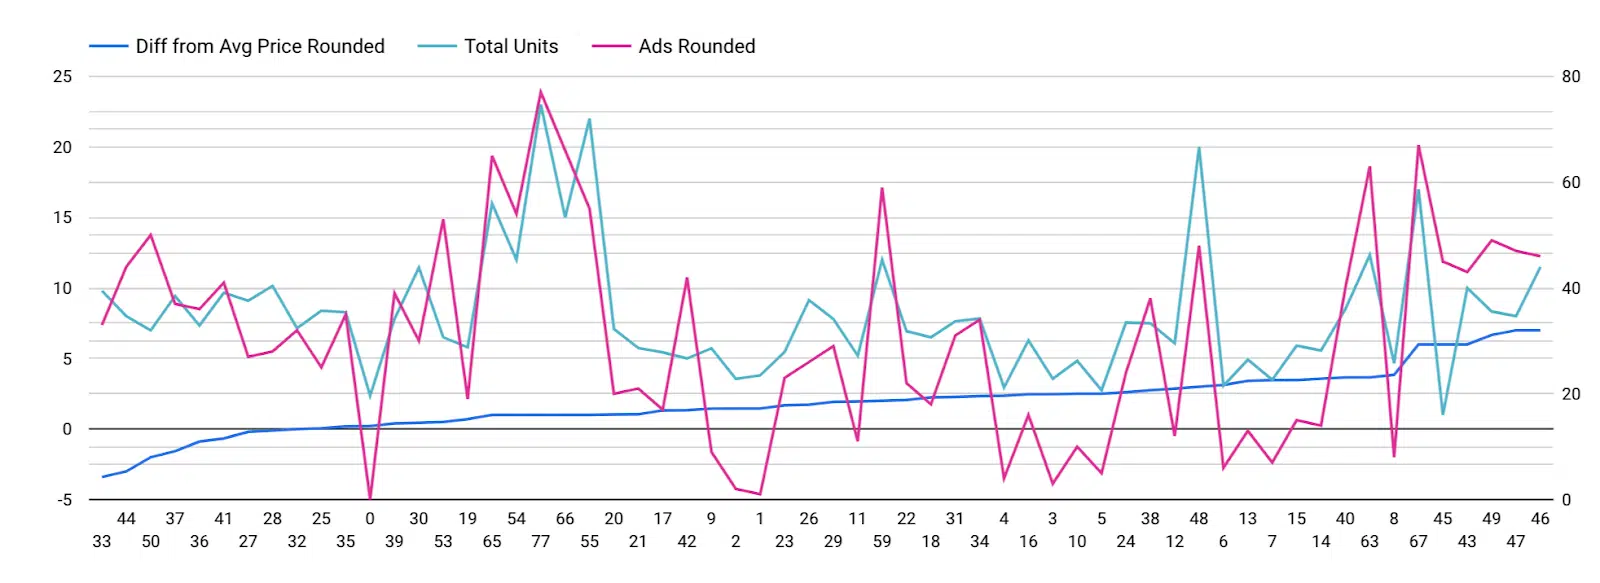
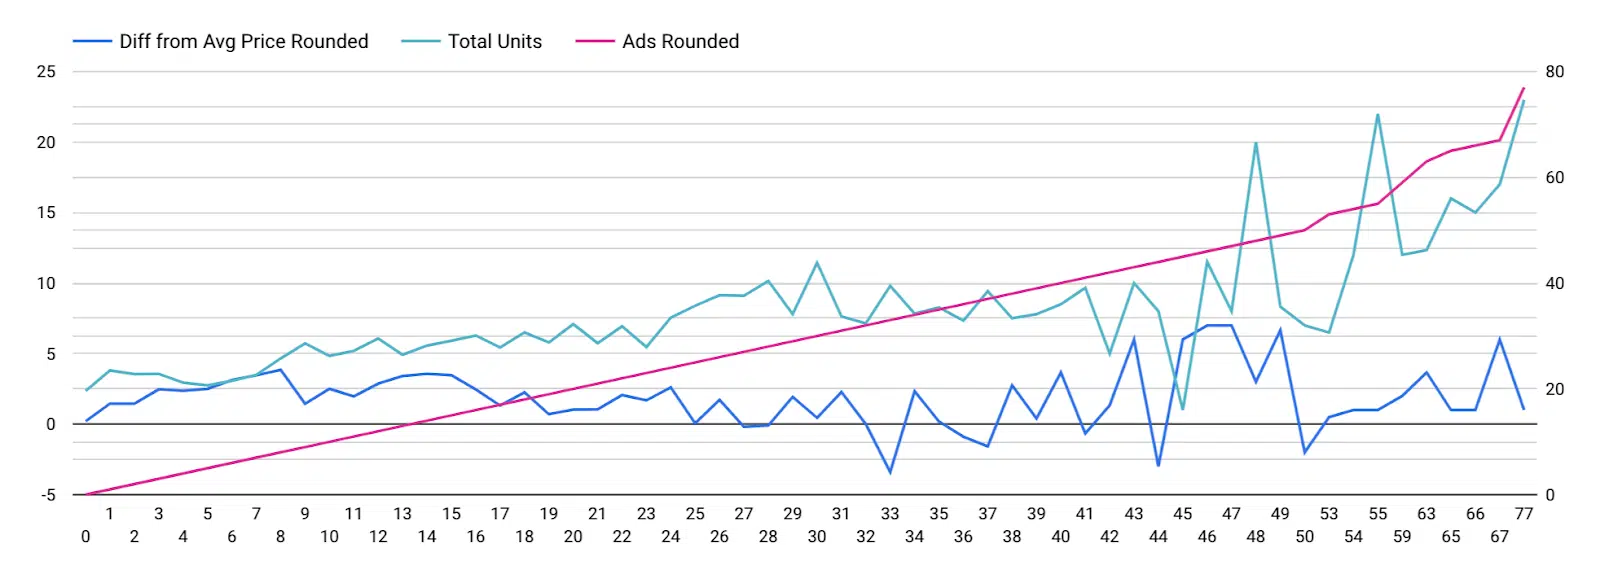
In the line charts below, we plot all three variables together for a comprehensive view.
The first graph is sorted by price differentials, with price increases represented by the blue line moving from left to right.
You would expect total units sold (green line) to decrease linearly as prices rise, but this isn’t the case.
Instead, sales (green line) appear to align more closely with ad spend (pink line), suggesting that ad spend has a stronger influence on sales than pricing alone.

In the second graph below, we plot the same variables, but this time sorted by ad spend.
As we move to the right, ad spend (pink line) increases. Here, we observe the expected effect: as ad spend rises, total units sold (green line) also increase.
While there is some correlation with price differential (blue line), it is notably weaker.

Insights
The data shows that both price and ad spend impact units sold.
While we anticipated a strong linear relationship between price changes and sales, this pattern doesn’t clearly emerge.
Instead, ad spend appears to have a stronger correlation with sales than pricing does.
This is consistent with the way the Amazon algorithm works. Advertisers commonly note that products rank higher on Amazon as their sell-through rate improves, and the fastest way to drive this increase is through substantial investments in Amazon Ads.
Dig deeper: 5 reasons Amazon Ads is better than Google Ads for ecommerce
Disclaimers
Firstly, all the products analyzed fall within the gifting category. It’s possible that gift buyers prioritize quality or appeal over price, making them less price-sensitive.
By contrast, buyers of commodities may respond more directly to price changes. Therefore, we cannot entirely discount the impact of pricing, as this pattern may be unique to the gifting category.
Additionally, analyzing a broad set of products to identify general trends may overlook individual product nuances. When examining individual products more closely, we may observe varying patterns.
Below, we present graphs for two individual products from our set. In the first graph, as ad spend increases, units sold also rise.
Large bubbles represent higher prices, and small bubbles represent lower prices, with both fairly well distributed across the data.

In the second graph, which represents a different product, sales volumes peak within a mid-range level of ad spend.
Here, the highest sales occur around the smaller bubbles, indicating lower prices. In this case, pricing appears to be the primary factor influencing sales volumes.

Our aggregated data study aimed to identify general trends between ad spend, pricing and sales.
However, in practice, each product performs uniquely, and the most effective approach is to apply this analysis on an individual product basis.
We recommend conducting a similar analysis for your own products to pinpoint the factors that most influence their performance.
To support this, we are sharing our data along with the Looker Studio template used to create these graphs, allowing you to build customized data sets for your products and compare your results.
Contributing authors are invited to create content for Search Engine Land and are chosen for their expertise and contribution to the search community. Our contributors work under the oversight of the editorial staff and contributions are checked for quality and relevance to our readers. The opinions they express are their own.
Related stories
New on Search Engine Land