Rotating ad copy: What traffic are you missing out on?
Want to see where your ad tests are finished, and what traffic you're losing by letting them run on? Columnist Daniel Gilbert of Brainlabs has a script for that.

Ad testing is massively important.
But you knew that already. You’ve set up all your ad groups with multiple ad copy variants.
But the thing is, you don’t want to test for its own sake. You can’t just write a bunch of ads and leave them. At some point, you have to make decisions — keep the winners and lose the losers. If you keep showing losers, you’re missing valuable clicks and conversions.
But if you’ve got a big account, it’s easy to lose track of all the tests going on. And if you’ve just inherited an account, you have no idea what tests were set up in the first place!
And that’s where the latest AdWords script from the team at Brainlabs comes in…
An AdWords script for finding your best ads
The script below goes through each ad group and finds the best ad. Then, it works out what could have happened if the other ads had been paused and all their impressions had gone to the winning ad. That tells you how much you’re missing out on (and which ad groups should be priorities when setting up new tests).
To do this, the script assumes the same number of total impressions for the ad group, but with the average performance — CTR, CPC and so on — of the winning ad (or ads, if there’s a tie).
Obviously, these are just simple assumptions. Realistically, the performance would vary because those impressions may have been of different quality (and even the number of impressions could have been different, because this ad/keyword combination could have a higher Quality Score and be eligible for more searches). However, it’s enough to give you a rough estimate.
You get to choose which metric makes an ad a winner — CTR is an obvious choice, but if you have enough converting traffic, then you can use conversions per impression, or value per impression, or something entirely different.
Note that there’s no statistical significance checking in the script — it just checks against click and impression thresholds — so if there are ad groups where the performance is close, you may want to check for yourself whether the winner really is the winner.
Oh, and the script looks at mobile-preferred ads separately from all device ads. After all, the mobile-preferred ads should be picking up all of the mobile traffic. If we treated mobile ads like regular ones, it would be inaccurate, as mobile traffic tends to be very different from desktop and tablet traffic.
To try this out for yourself, make a blank Google Sheet and take note of the URL. Then copy the script below, paste it into a new script in your account and change a few settings at the top:
- Put your blank spreadsheet’s URL into spreadsheetUrl. This is where the results will go.
- If you only want to look at ads in a few campaigns, you can enter phrases contained in campaign names which you would like to include in campaignNameContains. Or, if there are campaigns you don’t want to look at, you can list phrases contained in campaign names which you would like to exclude in campaignNameDoesNotContain. Or leave these both as [] to look at your whole account.
- If ignorePausedCampaigns is true, then the script will only look at currently active campaigns. Set them to false if you want to look at currently paused campaigns as well as the active ones.
- Similarly, if ignorePausedAdGroups is true, then the script will only look at currently active ad groups, and if it’s false, then paused groups will be included.
- conversionMetrics lists which conversion metrics will appear in the spreadsheet. Your options for this are “ConvertedClicks,” “Conversions” and “ConversionValue” — you can pick of many of these as you like.
- You have to pick which metric is used to determine the winning ad. Put that metric’s name in winningMetricName — this is used to name columns in the spreadsheet.
- The winning metric is calculated by dividing one metric (winningMetricMultiplier) by another (winningMetricDivisor). For example, if the winning metric is CTR, the winningMetricMultiplier is “Clicks,” and the winningMetricDivisor is “Impressions.”
- The script assumes the the largest winning metric is the best. You want the highest CTR or the highest conversion per impression.
- impressionThreshold and clickThreshold are the minimum number of impressions and clicks ads need to be considered.
- The script will look at the performance of the ads over a time period specified by dateRange.
- You can use predefined date ranges like “LAST_30_DAYS,” “LAST_MONTH” or “THIS_MONTH.”
- Or you can make your own with the format “yyyymmdd, yyyymmdd” — the first date is the start and the second is the end. For example “20160101, 20160630” would cover the 1st of January to the 30th of June 2016.
- currencySymbol will be stuck in front of any currency values (i.e., costs and conversion values) in the spreadsheet.
Once you’ve authorized and run the script, you should get a report with three worksheets. There’ll be an overview sheet, a bit like this:
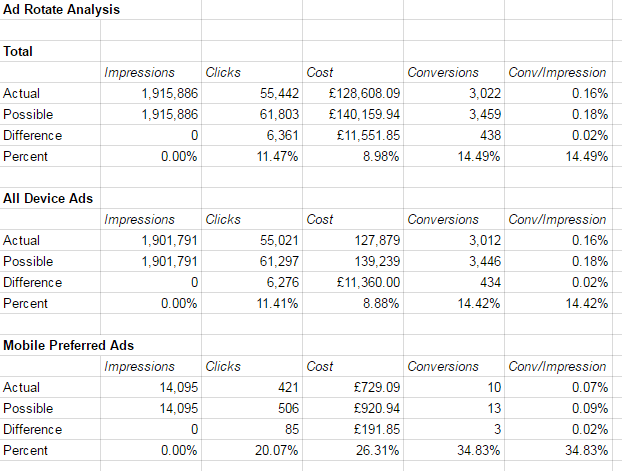
Additionally, there will be All Device Ads and Mobile-Preferred Ads sheets, which give you ad-group-level detail (including which ad was the best):

[Click to enlarge]
- Only enabled ads that aren’t disapproved are considered.
- Ad groups where all ads are tied with the same winning metric are ignored. For example if all winning metric values are 0, the ad group will be ignored.
- The totals shown will not be the same as your account’s totals. This only reports the performance of ad groups with winning and non-winning ads.
- If the winningMetricMultiplier or winningMetricDivisor are not already one of the reported metrics, they will also be reported on. For example, if conversionMetrics was “Conversions,” but the winningMetricMultiplier was “ConversionValue,” then both conversions and conversion value would be reported in the spreadsheet.
Contributing authors are invited to create content for Search Engine Land and are chosen for their expertise and contribution to the search community. Our contributors work under the oversight of the editorial staff and contributions are checked for quality and relevance to our readers. The opinions they express are their own.
Related stories
New on Search Engine Land
About the author