SMX replay: Visualizing Auction Insights data for competitive intelligence
James Hebdon of Paid Search Magic explains how you can curate Auction Insights data to analyze performance fluctuations, identify new competitors and more.
Understanding the metrics in Google’s Auction Insights and visualizing the data can give a clearer view of your account’s performance. James Hebdon, co-founder and CTO of Paid Search Magic, shared techniques for using Google Sheets and Scripts to transform Google Ads’ Auction Insights data into a clearer and more compelling report to your boss or clients.
Listen to Hebdon’s full Insights session talk from SMX Advanced last month, above and continue reading for his tips on how to handle your Auction Insights data. The full transcript is also available below.
Bonus tips. When analyzing Auction Insights or communicating your findings with clients, Hebdon suggests that you keep the following in mind:
- Auction Insights only provides data on the intersection of auctions that you and your competitors are participating in. Even pro marketers can find it tricky to understand, so be cautious with the conclusions you draw.
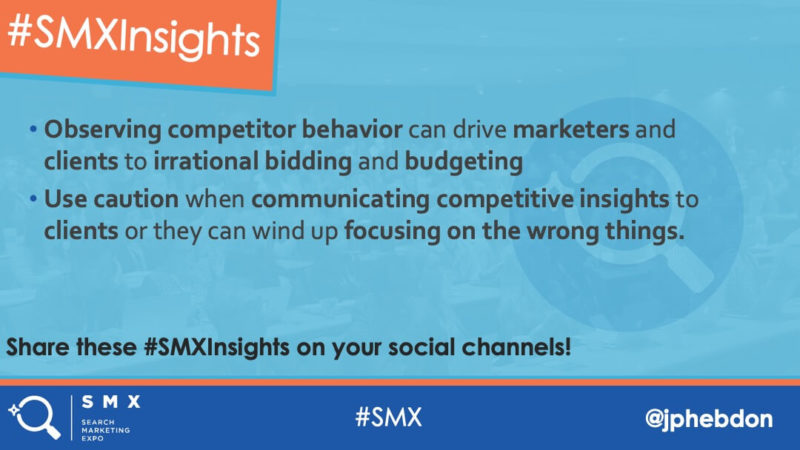
- Observing competitor behavior can drive marketers and clients to irrational bidding and budgeting. Use caution when communicating competitive insights to clients or they can wind up focusing on the wrong things.
- Both Google and Bing have improved the usefulness of auction insights within their respective interfaces, but by building automated templates with Google Sheets you extract even more useful information and create compelling, client-friendly visualizations.
- You can use this template as a starting place to build your own Auction Insights template.
More I
- Ashley Mo’s tips on improving your YouTube ad performance.
- Amanda Milligan’s guide on using data storytelling to earn top-tier media coverage.
- Patrick Stox’s session on SEO that Google tries to fix for you.
- Sam Marsden’s approach on building dashboards that inform and persuade.
- Helen Provost’s approach to using YouTube and automation to serve the full funnel of users.
If you found these sessions informative, consider attending them live on November 13-14, at SMX East in New York.
The full transcript.
Introduction by George Nguyen:
Auction Insights tools in Google and Bing can provide valuable competitive intelligence and bidding insights, but it can also be easy to misconstrue what the reports are telling you if you don’t know exactly how they’re designed to work . By understanding the metrics provided under Google’s Auction Insights and visualizing the data, you can gain a clearer view of your account’s performance.
Welcome to the Search Engine Land podcast, I’m George Nguyen and, on this edition, James Hebdon, co-founder and CTO of Paid Search Magic is going to share his techniques for using Google Sheets and Scripts to transform the information from Google Ads’ Auction Insights into something that’s easier to understand, and is more useful and more compelling to your boss or clients.
Before I hand it off to James though, I’d like to encourage you to check out our other SMX replays — we’ve got another one with tips on improving your YouTube ad performance — you can find that on the Marketing Land SoundCloud stream or as a link in the article that accompanies this episode.
Here is James now, with his Insights session from SMX Advanced.
James Hebdon:
Hey everybody, my name’s James Hebdon and I am the CTO and co-founder of a boutique paid media agency called Paid Search Magic. And today I am talking to you about a tool called Auction Insights, which is a free Google tool that they provide to give you some limited insights into some competitive behavior.
Now, the reason why I wanted to talk about this is that it’s a broadly misunderstood tool. A lot of people have used it; if you go and do a search on YouTube, you’ll get lots of really flashy images that talk about, you know, spying on your competitors. It’s a much more limited tool than that. But if you know how it works and you know how to treat it right, it can give you a lot of insights into your competitors.
Now, early on in internet marketing, there were a lot of academic journals that started getting published about auction theory, applying game theory to auctions, bidding techniques, things like that. And, one of these earlier papers, the researchers were surprised to find out that, unlike a lot of traditional auctions or auctions like eBay, people that were working within Google Ads . . . didn’t exhibit the same type of irrational behavior that people did in other areas; it’s called, you know, “the joy of winning,” or “auction fever.” And they speculated that this was because, unlike these other auctions, the bidders are secret, the bids are secret and you don’t know who the winner is. But they didn’t really drill into it more than that because it wasn’t the focus.
But, a more recent paper that was released by Princeton, they got a bunch of volunteers together and they sat them down in front of a computer terminal and they instructed them on how to deal with auctions, like the best way to do an auction. And, when these people thought that they were competing against the computer, they took the instructions, they did it properly and they managed to not overpay, which is kind of the metric that was used in the study.
However, when they were told that they were competing against humans, almost without exception, the volunteers — even though they had been instructed in how to do it right — they almost all found it impossible to behave rationally. And, that’s just part of the human condition, right, is that we have a difficult time with that.
So, the reason why I’m bringing this up is because using auction insights data can be really, really compelling. In fact, one of the most common uses of it is to show it to clients because when they see that, in front of them, you know, the different competitors that are coming up, how aggressive they are, and you use some of these other techniques we’re going to talk about to show them how they’re behaving, it can really compel a different behavior. They can be more interested in bidding and protecting their brands, things like that. But, you have to use caution because it can also get them to focus on the wrong KPIs.

Now, another thing you got to understand about how Auction Insights works is that it is much narrower in scope than a lot of people think. So, in this whole keyword universe thing here you have a single search term that is triggering a bunch of different keywords, right? And, sometimes they can be really, really different keywords. And, over the past several years, Google has been taking several different steps to broaden the match typing that is going on, making many more people eligible for auctions.
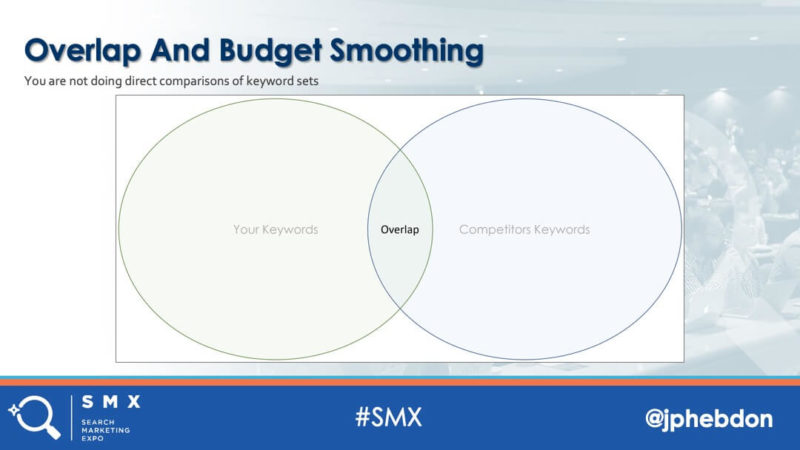
So, the Auction Insights data exists in kind of this narrow intersection that brings up the first metric, which is called an “overlap rate.” And, only in that little overlap, where both you and your competitor are participating in or are eligible for those auctions, do you get any visibility into what they’re doing. Everything that’s on the outside of those circles, you don’t get any information.
Now, Google has a lot of techniques that they use for like budget smoothing and things like that. And, one of those things is that, you know, they have some techniques to try to efficiently exhaust advertiser budgets and they do that through a selection process of determining who’s eligible. That’s not always consistent and it’s not always known, which introduces another unknown element to the types of information that you can infer from Auction Insights data.
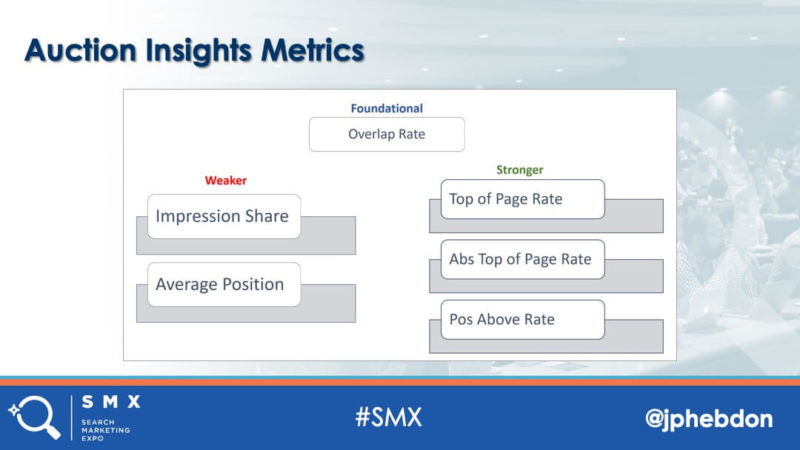
So, with kind of all this stuff out of the way, like this is stuff that you need to understand so you don’t pass on bad information — so you don’t take irrational, budget increases or bids or anything like that. These are the metrics that are available with an Auction Insights. The foundational one is that overlap rate because it indicates exactly how much that competitor is overlapping with your keyword set. It’s an indicator of how much like your company they are — basically, how much their product set, how much the keywords that they bid on are similar to yours.
So, if you use that as an indicator of that, then you can make a lot better use of the other ones. Things like impression share, average position, are just weak metrics. Average position is going away for a good reason — it’s because it’s a bad indicator; it’s easily skewed data. The stronger metrics are top-of-page rate, absolute top-of-page rate, position above rate — those all indicate how competitive people are. So that’s the foundation — that’s the things that you have to know just so you don’t screw up the rest of it.
Now, the state of automation right now is such that there’s no API or script access to Auction Insights data. There is some limited access through Data Studio. It doesn’t give you a lot of the transformations that you can get from just downloading the data straight from Google Ads. The template that I use and that is available via a link at the end of this presentation uses Google Sheets as its primary, like, data drop zone. So, you can just like take the data from Google Ads, drop it in there and then it automatically populates all the visualizations and everything that you need.
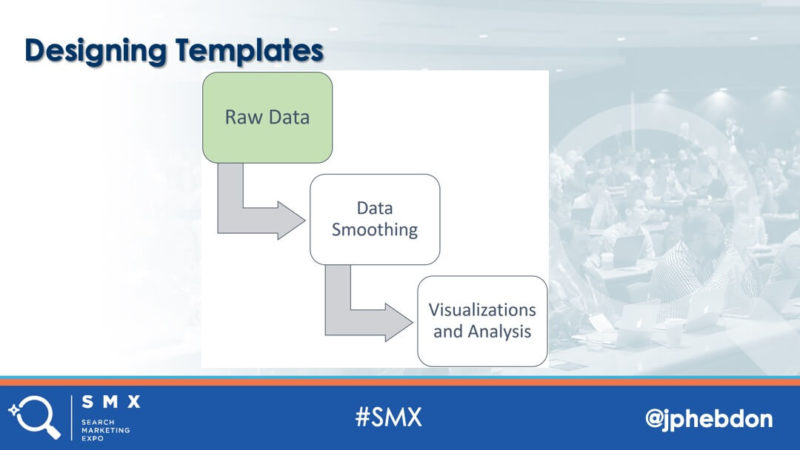
Now, I can’t go through all the formulas and everything like that, that you would use in something like, you know, an Auction Insights template. But, it’s good to know like just the steps of it so that you can make changes to it if you want, so you can build your own if you want, and the first part is just getting the raw data. You have to determine, first of all, the date range that you want to look at, the time segment that you want to look at. So, 30 days, by day, you know, past 30 weeks, whatever; you have to get the start date and the end date, download the data.
Then you have to focus on the actual area that you want to. And this can be really tricky because if you just look at campaign data, like at an account level, you will get garbage, you’ll get a general idea of all the different competitors that are in the market, but you’ll have no idea of what they’re really doing, especially if you’re running both search and shopping campaigns. Never mix that kind of data because it’s so fundamentally different that it skews anything useful that you might get from it. Generally speaking, the higher level that you go, the less precision and the less you can confidently infer from the data.
When you do segmentation, you can also segment the data by device and increasingly this is a big deal because the user behavior when it comes to device types is so fundamentally different. Metrics like average position is not worth even looking at it if you’re combining all those different devices together. Position one on a mobile device is a much different thing than position one on a desktop. If you combine the data, then you’re not getting anything useful from that.
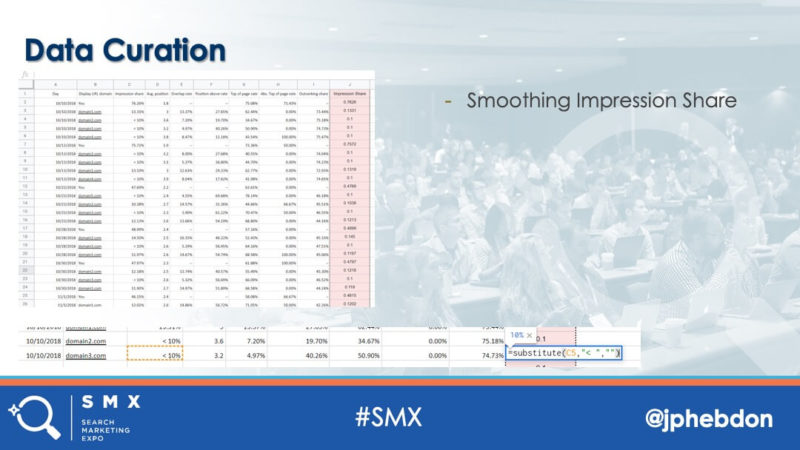
Now, the next thing that you got to do in any sort of a template is you need to smooth the data. Even if you’re doing this by hand, you have to do this. So, like one of the metrics, search impression share, if you have less than 10%, it will add like some dashes and some brackets and things like that; you have to clear that out. By using a template, by using these functions, like the little substitute thing at the bottom there, you can take those off automatically, so you never have to deal with it. Again, the whole idea of this automation is that you do at once, you never have to do it again.
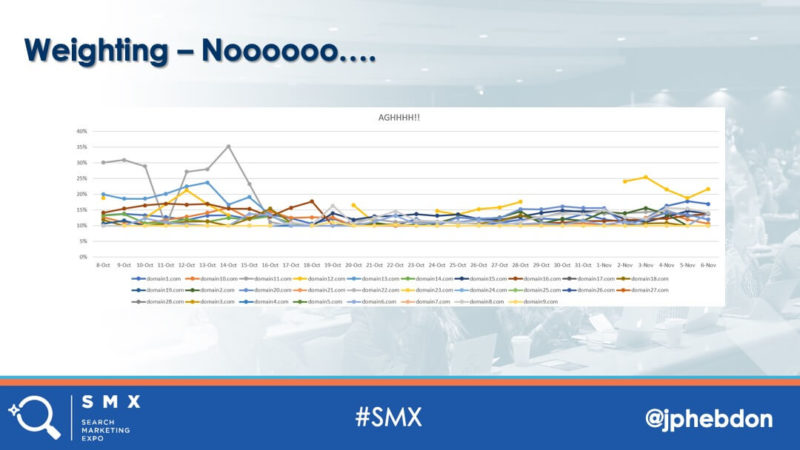
Now, the biggest thing you have to do with data curation is that you actually have to prioritize the competitors that you’re looking at. You can have 30 competitors that will pop up in Auction Insights data that you download. This is a graph of what they look like. If you graph all of them. There’s almost nothing useful that you can get from that. Maybe a couple of peaks that you could dig into a little bit more. But other than that, it’s just noise.
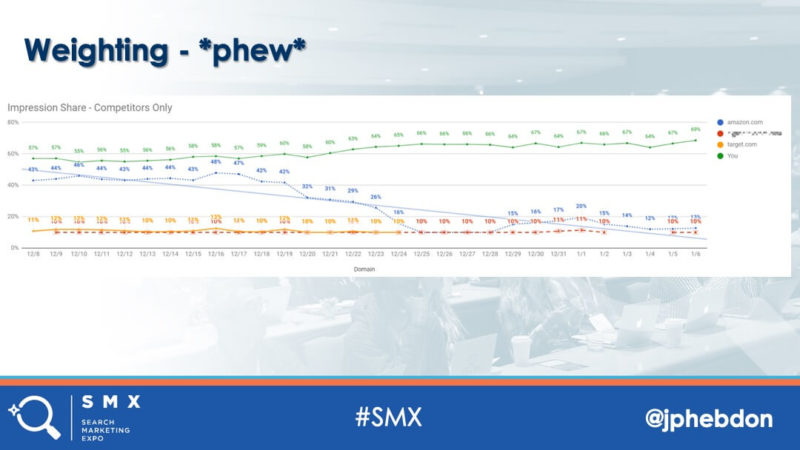
However, if you can rank them, if you can rank your competitors in some way, then you can get something that is a lot more useful. Something that indicates actual behavior and how it might be impacting you.
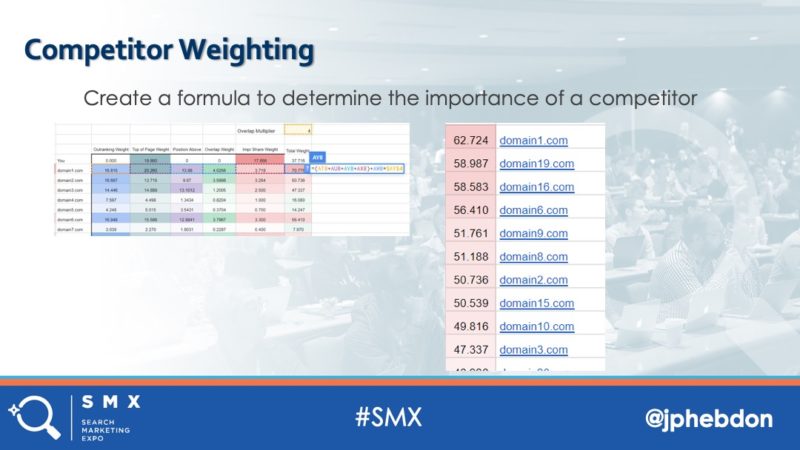
The way that we do that is going back to the, you know, all-important overlap rate. You use that as a foundation. You add it to a multiplier, you add the rest of them up and it’s going to give you a much better indication of who your primary competitors are because there’s going to be a lot of like little competitors, especially on Microsoft Ads. You’ll get a lot of ad arbitrage sites and things like that. So, you get these top competitors and now you have a nice list and you can focus on just the top few.
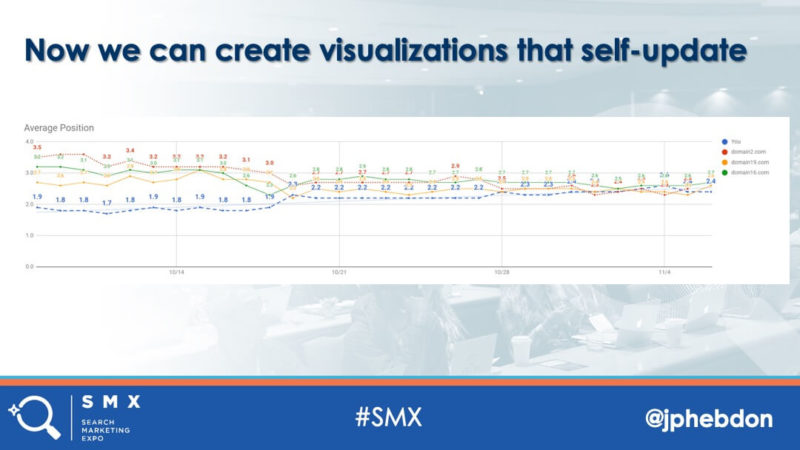
So, the final thing, and this is the good part, is that you start getting to the actual visualizations. You have the data. It’s automatically populated. These formulas, you can go back and look at them and they’re also on the link at the end. But, when you get all that done, then you can start getting these nice clean visualizations. Now you can actually see if there are changes that are occurring when you’re trying to analyze for performance fluctuations or if you’re trying to determine what the impression share is or entrance into the market, things like that.
Another tip, that when you are looking at impression share, if that’s an important metric to you, you need to take it out to really analyze your competitor to behavior. Because of the way that this Auction Insights data is calculated, if you leave yourself in, it will skew all the rest of the data and you can’t really indicate anything from it.
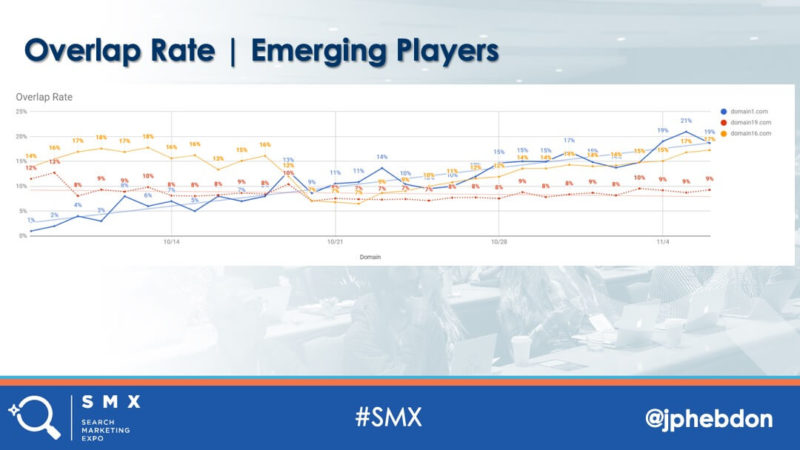
By using overlap rate, you can — these are, by the way, all actual data from clients that have been anonymized — but you can actually see new people that are entering into the market. It’s really useful to see that, especially if you start seeing your CPC fluctuations.
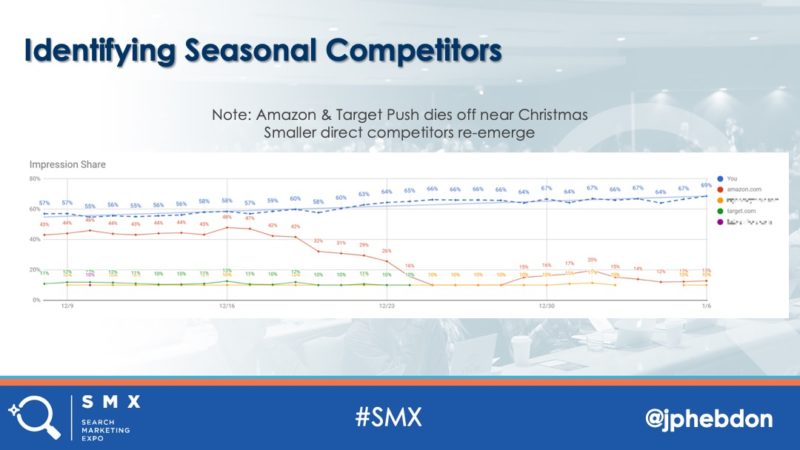
It’s a great way to identify seasonal competitors. You see Amazon in here, they, all the way up until right before Christmas, they’re incredibly competitive with this client. Then they just drop out to nothing during the Christmas season and then they go back up to just a bare presence.
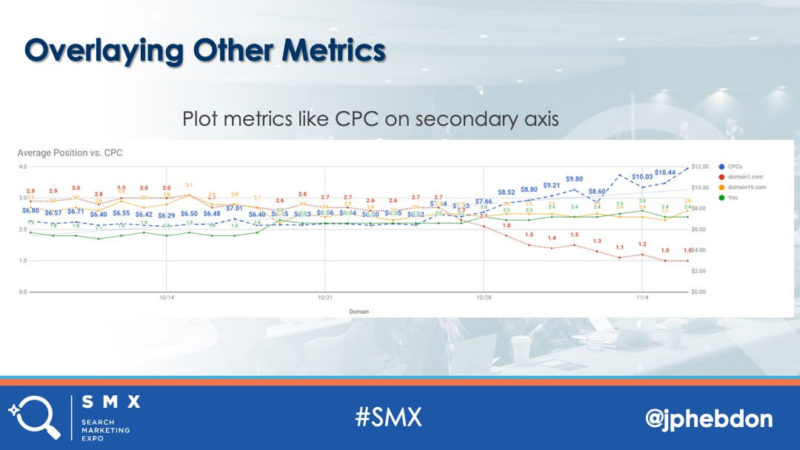
Now, the last thing on this is just overlaying other metrics. The key thing here is just to make sure that you are using the same date range and the same time segment. As long as you have that as your core, then you can compare it to the Auction Insights metrics and if you see a competitor that suddenly starts to rise in position, that’s probably a pretty good indicator that your CPCs are going up or that your average position’s going down.
Now, there’s a lot that you can do to draw conclusions from this data: You can do things like identify bad faith affiliates. I’ve done that, where basically you find out that they are bidding on your client’s brand against rules. You can determine competitors that are conquesting, where they’re targeting your brand terms specifically.
Auction Insights myths, this is the last thing: You cannot back your way into competitor budgets and you cannot determine the keyword set of a competitor. The data’s just not there.
Microsoft ads is a little bit different. They do provide this data. The core metrics are a little bit different and you can only segment it by a limited amount of time, but outside of that and the general they have more noise in the data, you can apply the exact same template to that data as well.
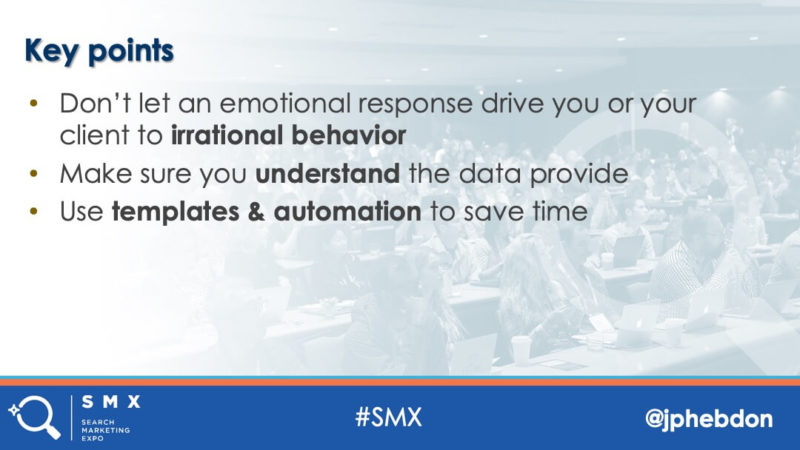
So yeah, so don’t be emotional when you’re looking at the data. Be careful on how you convey that information to your clients because they will take it and they will be compelled by it. Don’t be irrational in how you sell it to them, even if you really want them to raise that brand budget because it can backfire in a big way. Besides that, just make sure you understand the data and use automation because it will save you enormous amounts of time and give you something that can really, really help you as you’re managing your clients. Thank you.
Contributing authors are invited to create content for Search Engine Land and are chosen for their expertise and contribution to the search community. Our contributors work under the oversight of the editorial staff and contributions are checked for quality and relevance to our readers. The opinions they express are their own.
Related stories
About the author