Three of the most important data segmentations for any Google paid search analysis
Wondering how to make sense of your AdWords accounts? Columnist Andy Taylor discusses how to segment your paid search data for meaningful insights.

Just a few years ago, the paid search landscape could adequately be summed up as “text ads on desktop computers.” This simplicity meant analyzing performance didn’t require too much slicing and dicing to get meaningful takeaways from paid search data, and often a simple brand vs. non-brand look would do the trick.
With the rise of additional ad formats and devices, however, understanding search performance requires that PPC managers and analysts dissect their data in several specific ways before coming to any conclusions.
Here, we delve into the most important of those segmentations and why each is critical in paid search performance analysis.
Device segmentation is critical
According to Merkle’s Q1 Digital Marketing Report (registration required), the share of paid search traffic coming from desktop computers is now just 47 percent, with 39 percent coming from phones and 14 percent from tablets.

For most advertisers, these devices perform very differently from one another. For example, on average, phones produce revenue per click that’s 62 percent lower than that of desktop computers for Merkle advertisers, while tablet revenue per click is 30 percent lower.

So lumping all three device types together when analyzing performance can hide the details of the true value of each. By segmenting, advertisers can understand how each device type is performing and set bids accordingly.
While Google campaigns used to lump desktop and tablet computers together for use in keyword base bids, recent updates announced these two device types will be split up, and advertisers will also now be able to set desktop, tablet or mobile as the base bid for keywords.
Aside from different per-click value, there are also frequently updates made by the engines which stand to impact only a single device type. For example, Google’s addition of a third text ad above the organic links on phones in Q3 of 2015 significantly increased mobile traffic, with phone clicks up 51 percent for that quarter.
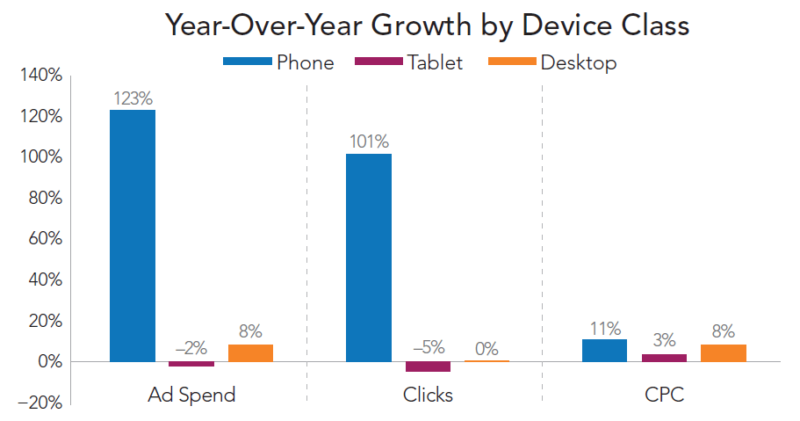
Overall traffic also increased, but with desktop and tablet traffic essentially flat, all of the overall growth was driven by phones.
Thus, segmenting by device is crucial in understanding which device types are driving overall performance shifts.
Product listing ads and text ads are best analyzed separately
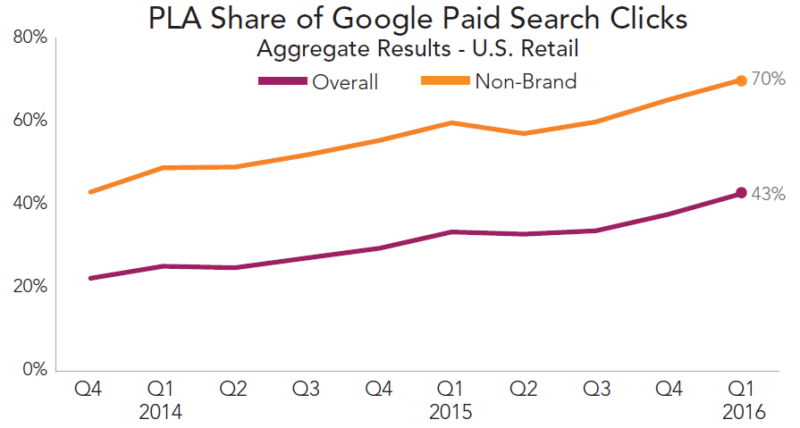
Equally as important as the rise of mobile devices over the past couple of years has been the increase in the share of paid search traffic coming from Google Product Listing Ads (PLA). These image-based ads have grown significantly since their inception in 2009, and accounted for 70 percent of all non-brand paid search clicks in Q1 for Merkle retail advertisers.
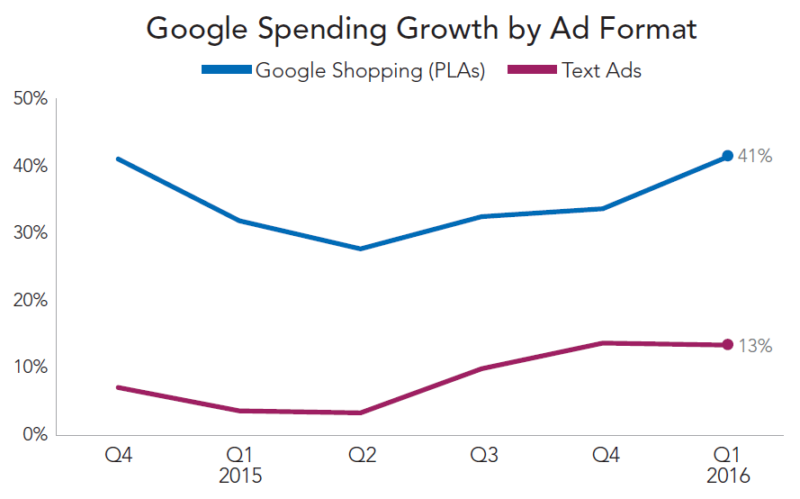
Obvious from this rise in share is the fact that PLA spend growth has far outpaced that of text ads for some time now, and in Q1 Google Shopping, spend grew 41 percent, compared to just 13-percent growth for text ads.
Similar to different device types, some Google updates only impact one of text ads and PLAs. For example, the addition of a third text ad above the organic links on mobile devices mentioned earlier spurred on an acceleration of text ad growth relative to PLA growth in Q3 2015.
Apart from significant differences in growth opportunity over the past couple of years, PLA and text ad optimizations can also be very different beasts.
PLAs are generated using advertisers’ product feeds, which consist of information such as product title, color and price. Succeeding with PLAs requires that advertisers populate feeds with all of the information required by Google, as well as optimize fields such as item title and description to display relevance for search queries that each product might show for.
Text ads, on the other hand, are triggered based on keywords each advertiser chooses to bid on (or through Dynamic Search Ads, which rely on Google combing a website to determine relevant queries).
Thus, identifying issues that might be hindering performance can require very different approaches for text ads and PLAs, and each is best analyzed independent of the other.
Search partners perform differently than Google.com
Another key bit of segmentation that stands to help advertisers better understand paid search performance is breaking out search partner performance separately from google.com.
The Google search partner network is a group of sites that use Google to power their search results. Advertisers can choose to target their ads to these sites along with google.com or exclude them entirely using AdWords campaign settings.

For advertisers that opt into targeting search partner sites with their campaigns, it can be valuable to regularly check how search partners are performing relative to google.com. While it’s not currently possible to adjust bids for search partner traffic, understanding relative performance can help determine if a particular advertiser should continue targeting partner sites.
It’s also important to understand how search partners are performing because the sites that are included in the network frequently change, which can in turn impact overall performance evaluations.
For example, back in 2014, eBay switched its mobile ads from Google-powered to Bing Ads-powered. This resulted in a significant jump in mobile traffic share for Bing Ads, from 25 percent in Q1 to 36 percent in Q3 of that year, while over the same time Google mobile traffic share remained relatively stagnant.
If eBay had remained with Google throughout the course of 2014, Google’s share likely would have increased while Bing Ads would not have seen the gains we observed.
The only way to fully understand why mobile traffic share shot up on Bing Ads and stagnated on Google was to look at performance segmented by search partner vs. google.com. Further, there have been many updates since which also impacted search partner performance, and which require segmentation to grasp.
Great analysis requires great segmentation
The best analysis doesn’t require genius — it just requires thoroughness.
Part of that thoroughness is ensuring that the data you’re looking at is segmented enough to show meaningful trends for the segment you’re looking at. If it’s not, you might be getting deceived by the numbers you’re seeing and come to incorrect conclusions.
Device, ad format and search partners certainly aren’t the only segments advertisers should be taking into consideration, but they are meaningful for the vast majority of paid search analyses today.
For example, all three should be taken into consideration in analyzing the difference in performance of Google’s new Expanded Text Ads compared to traditional text ads.
The paid search landscape has steadily gotten more complex, and it’s up to analysts to dissect that complexity into simple segments that can be studied for trends and potential optimizations.
Contributing authors are invited to create content for Search Engine Land and are chosen for their expertise and contribution to the search community. Our contributors work under the oversight of the editorial staff and contributions are checked for quality and relevance to our readers. The opinions they express are their own.
Related stories
New on Search Engine Land
About the author