Using PPC Run Charts To Identify Problems & Opportunities
Back in the 70’s, when the World Wide Web was still just a glint in Tim Berners-Lee’s eyes, a pair of Stanford grads working out of their garage started a world famous technology company called Hewlett-Packard. Sounds familiar, doesn’t it? What is it about Stanford students that makes them want to start businesses in their garages? […]
Back in the 70’s, when the World Wide Web was still just a glint in Tim Berners-Lee’s eyes, a pair of Stanford grads working out of their garage started a world famous technology company called Hewlett-Packard. Sounds familiar, doesn’t it? What is it about Stanford students that makes them want to start businesses in their garages?
Anyway, what is interesting about Bill Hewlett and Dave Packard practiced a management style known as MBWA, which is short for management by walking around. They felt they would have a better grasp on what was really happening in their company if they would wander through the company and talk with their employees instead staying in their executive office crunching numbers all day long. They were so successful that MBWA soon became a required study in many top business schools around the country.
Taking a page from their book, I’d like to suggest that we SEM account managers can get a much better handle on our PPC campaigns work if we start practicing MBCA – management by clicking around.
PPC campaigns, especially mature successful ones, can be truly complex beasts, filled with thousands of interdependent data points.
Speaking from personal experience, I find it is very easy to get completely disoriented when working deep inside the dense forests of keywords, ads, bids, budget and targeting options, and become utterly incapable of deciding what to do next.
When this happens to me, I often I step back, way back, all the way to the account level and try to get a bird’s eye view on what is happening inside a particular account. I always find that working with the graphical trend line charts helps me regain my bearings and then be able to drill deeply into campaigns and ad groups to diagnose problems or identify opportunities.
These wonderful orientation tools are available free of charge within Adwords, AdCenter and many third party management tools.
Diagnosing PPC Problems With Run Charts
When you discover a problem with one of your accounts, (by which, I mean when you get a call from your client first thing on a Monday morning demanding to know what the Q$#&#!! is going on with their campaigns) you want to quickly dive in and resolve it. But knowing where to start is often the problem with complex campaigns.
Here’s one we encountered recently, shown graphically in the AdWords interface:
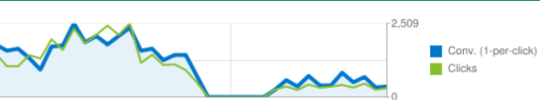
Not a good trend - conversions and clicks way down
As you can see, both clicks and conversions first dropped to zero, and then once restarted, they only reached half of their former performance levels. Now, in this case, we knew that the campaigns went offline for a week or so, at the end of a quarter, as we had blown through our allocated budget and had to go offline.
However, what could explain the poor performance on relaunch?
Our first guess was daily budget set too low, but that was not the case. So we started to play around with the graphing options, setting two metrics against each other to see if we could pinpoint the problem.
Did we set the bids too low, perhaps? We set the chart to show Clicks vs. Avg CPC, and yep, sure enough, we were paying quite a bit less for our clicks.

Lower CPC leads to lower avg position and fewer clicks.
Low bids would lead to lower ad position and lower CTR, so we were pretty sure we had nailed this problem. However, before we went and upped our bids, we decided to also set the chart to show how CTR had suffered, too.
What we found really surprised us:

CTR Increased - even though CPCs were way down!
CTR was higher than it had ever been!
That didn’t make any sense! How could that be? Much lower CPC and yet have much higher CTR? We then looked at Avg Position, and notice it declined a little, but not enough to reasonably explain the decline in clicks.
Then, it dawned on us that we were still looking at both search and display network performance charts.
So, when we we filtered out for only search clicks, and we see that our Average position got worse, as we would have expected with lower CPCs. This started to make sense again.
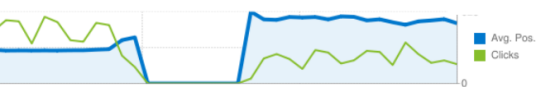
Lower CPCs definitely led to poorer ad positions.
Doing the same for CTR, we see that the CTR for our search campaigns – is still higher inspite of poor position:

Even with lower Avg Position, CTR still shows higher. Strange.
Lower click volume, yet higher CTR. Clearly, something else is at play here, preventing us from getting our clicks and conversions. The next metric to compare is impressions. So now we compare impressions against clicks for the same period and we find that impressions are also way down:
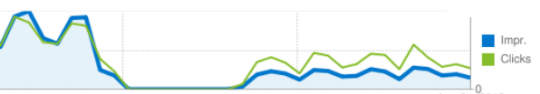
Comparing Impressions to Clicks - Impressions way down
Okay. Okay. Something is preventing impressions. That would certainly explain the drop in clicks. So that led us to check the Change History Report for clues.
Did we add negatives? No. Did we change ads on relaunch? No. Did we change landing page on relaunch? Again, no.
We then checked our keyword reports, and found that one of our terms, a pharma term which had been our best performing keyword, had been taken offline (without any notice, I might add) in a big take down of a lot of pharma terms that Google had done when they were coming under tight regulatory pressure to do more to prevent unregulated online pharmacies from doing business online. We appealed their decision and after awhile, they allowed the terms once again.
This is one example of how clicking around in the high level views of the data can help you more quickly eliminate suspected problems and make sure you are solving the right problem.
Finding Opportunities With Run Charts
As I mentioned before, the complexity of PPC campaigns can make it difficult to figure out what areas need attention and which areas of our accounts have untapped potential.
Simply clicking around in data charts can let you spot opportunities and problems more quickly than massive rows and columns of data. Here’s an example of a good chart, taken from a tool we use internally, Acquisio, to help us manage campaigns.
In this example, we can see that as we continue to increase ad spend (grey line) conversions continue to rise (green). A simple conclusion is that we should continue to increase our ad spend and make sure budget is not constrained until we see the lines diverging.
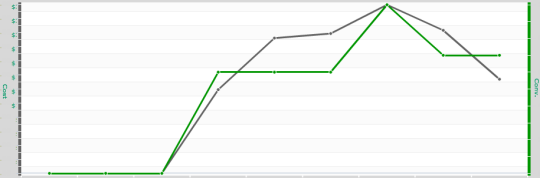
When Ad Spend and Conversion trends look like this - spend more!
The nice part about PPC management by clicking around on the performance run charts that Google and Microsoft provide you is that you can quickly identify clear problems and clear opportunities within your account without having to know a thing about the keywords, bids and ads that sit below this level of abstraction.
Not all charts are easy to interpret and there are time-proven statistical methods you can use to know when you have data worth acting on, and when the ups and downs within your performance charts represent real changes or are just random variations within your expected data ranges.
Contributing authors are invited to create content for Search Engine Land and are chosen for their expertise and contribution to the search community. Our contributors work under the oversight of the editorial staff and contributions are checked for quality and relevance to our readers. Search Engine Land is owned by Semrush. Contributor was not asked to make any direct or indirect mentions of Semrush. The opinions they express are their own.


