These 10 Analytics Reports Will Improve Your AdWords Results
I recently hosted a Hangout for the Google Partners community about how Google Analytics (GA) and AdWords can work together to help improve PPC results. With the speed at which new features get added, it’s easy to overlook one or two cool capabilities so here’s a roundup of 10 of my favorite ways to use […]
I recently hosted a Hangout for the Google Partners community about how Google Analytics (GA) and AdWords can work together to help improve PPC results.
With the speed at which new features get added, it’s easy to overlook one or two cool capabilities so here’s a roundup of 10 of my favorite ways to use Analytics to improve AdWords performance. Some of these reports are oldies but goodies and some are just a few weeks old, but they all deserve to be part of our SEM toolkits.
AdWords And Analytics: Better Together
AdWords is great at telling you how much money your ads cost and how many conversions you’re getting but what happens between the click and the conversion remains a mystery unless you add GA to the equation. It can tell you what people do on your site, so if they’re not converting, it can help you find out why. And when you can fix conversion rate issues, your AdWords performance will get better.
The simplest way to get started is to import a GA view into AdWords to get access to four new data columns: “Bounce Rate,” “Pages/visit,” “Avg. visit duration,” and “% new visits.” These can be extremely helpful to get a more complete view of what is happening with your ads. Let me give an example next…
Don’t Delete Zero Conversion Keywords
…at least not before asking a few more questions first. Say you have a bunch of keywords that have 0 conversions. You might be thinking about deleting these or lowering the bids drastically. But keep in mind that the conversions you see in AdWords are last-click conversions, so only the last keyword that got a click in AdWords will get the credit for the conversion.
Knowing that many consumers do multiple searches while researching a purchase, it’s obvious why making a decision based solely on last-click conversions might be the wrong one… you might be eliminating the keywords that drive upper funnel activity, leaving yourself with fewer users who come out at the end of the funnel too.
Here are two things you can do to check if these are truly bad keywords:
1. Check if you have high engagement for these keywords, e.g., high numbers for “avg. visit duration” and “pages/visit,” as this can be an indicator that the problem isn’t with the keywords but rather with your site where the users are not finding what it is you promised them in the ad.
After all, a user who spends a lot of time on the site must think they’ve come to the right place, they’re just not finding what they need easily. The solution in this case could be to try more relevant landing pages.

Add the Analytics columns “avg. visit duration” and “pages/visit” to AdWords to help you find keywords that bring in engaged users.
2. Look at the column “% new visits” to see if these keywords are driving new users into your funnel. If the keyword drives a lot of new visitors, the next step is to use the Search Funnels report in AdWords or the Assisted Conversions report in GA to see if these new users eventually convert using different keywords, or even through different channels.
If this is the case, try to figure out how to value these keywords because eliminating them could really backfire.

Use Search Funnels data to determine if 0-conversion keywords may be driving upper funnel activity and first-click or assisted conversions.
To help decide on a model for how to value these keywords, try the GA Model Comparison Tool, which will show you the value of each keyword using some standard models, or using your own custom one.

Use the Attribution Model Comparison Tool to try out different attribution models like Last Interaction, First Interaction, or Position Based, to get a better grasp on the true value of your PPC.
Find Bad Landing Pages Quickly
Use the columns “bounce rate” and “avg. time on site” in addition to “conversion rate” to find ads that are neither converting, nor engaging users.
Then analyze the worst offenders and bucket them based on the probable solutions which could be one of the following: fix the keyword relevance, pick a better landing page, fix ads that may be misleading, or if your site has a high bounce rate across the board, address the elements that seem to make users think your site is not trustworthy.
While AdWords provides a good starting point to find poor landing pages, one of the issues is that it’s not good at aggregating the data. What I mean is that you have to ask the same question over and over again in many different ad groups.
To be efficient you should look at the data for landing pages across your whole account, and this is where the GA Landing Page report comes in handy. If several ad groups use the same landing page URLs, it totals up all the stats for you so that it’s easier to quickly hone in on bad landing pages that may be used in many places throughout the account.
GA Lets You Track More Complex Conversions
The AdWords conversion tracking code I helped create over 10 years ago (my first project with the AdWords product team) still serves its purpose well for tracking simple conversions.
However, many advertisers want to track more than just views of a key page like the order confirmation page, e.g., how many people called after visiting your site from an ad, or how many people watched your product demo video. Both of these actions don’t have a corresponding page so tracking is a bit more complex.
In the case of tracking phone calls after the ad is clicked, the third-party vendor that handles your call tracking (Mongoose Metrics, IfByPhone, CallRail, LogMyCalls, …) will fire either an event or a virtual page view to GA when a call lasts longer than your specified minimum duration.
That in turn is set as a goal which can then be imported back into AdWords, and associated back to the GCLID (Google’s click tracking parameter that helps it uniquely identify every click) so that it shows up as a conversion next to the correct keyword, ad, and ad group.
The only real downside, in my opinion, of using GA to track conversions is that there is a bit of a delay for when they are imported: normally 24 to 48 hours but sometimes 72 hours!
As a result of this delay, your AdWords CPAs will always look pretty weak for the past 2 days so if you’re trying to manage bids very frequently using only data from AdWords, you have the added complication of having to account for the delayed conversion data.
When You Have No Macro Conversions, Look At Micro-Conversions
A common problem in AdWords is that it’s hard to track different types of conversions when you don’t necessarily want to treat all types of conversions the same.
A simple example is that you have two campaigns, one with the goal of selling products, the other with the goal of building your email list. If you track both conversions, both campaigns will reflect both conversion types and it’s hard to segment it back out so that you’re not counting email signups as sales in the campaign that is trying to sell products.
There are a few possible solutions in AdWords, e.g., you can choose to count unique conversions or just converted clicks if you don’t want to double count leads, or you can assign a conversion value of 0 to conversions you don’t want to factor into an ROAS based bid strategy, but sometimes you want something a little more sophisticated.
In AdWords, it’s just not easy to see data broken out by individual conversions. In Analytics, on the other hand, you can easily customize an AdWords campaign report to show several types of goals side by side, making it much easier to understand what the users are doing after they click your ad.

Compare the performance of all of your goals side-by-side using the AdWords Campaigns report in Analytics. You can even see the performance of goals you don’t import as conversions.
You can even use this data in cases where you’re not successfully driving the expected conversion. By looking at different conversion types, you’ll see if those keywords are at least driving some signups for the newsletter, or completing another micro conversion on your site, something that still has some value or that could be a predictor of a sale much further down the line.
Once you determine that a particular campaign is a bit weak in terms of driving the completion of conversions, you can use the Goal Flow report to compare how different campaigns move users through the stages of your funnel.
This can help identify where the users are dropping off. Perhaps there’s one of the pages in the funnel that’s just not working well for some users, for example, if you charge for shipping and you don’t have a cheaper option for the products in your new line of value-oriented products, that could cause a significant drop-off compared to your other product lines.

Compare the Goal Flow report for all your AdWords campaigns on a single screen to help find if a particular campaign is doing a poor job of moving users through your funnel.
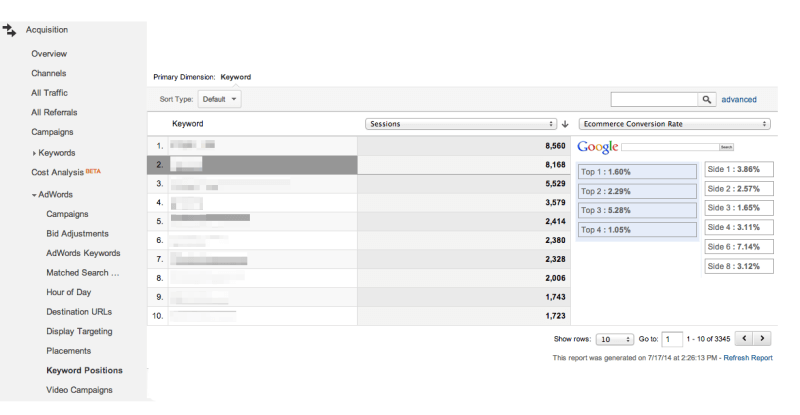
Being #1 Isn’t Always Great
If you manage AdWords ads and you’re not the boss at the company, you’ve probably gotten a frantic call from someone higher up the chain to ask: “Why aren’t our ads in position 1 anymore?!?”
A good answer would be to explain that ad positions were tested and it was determined that the top slot was not worth the extra cost. Or maybe you can even show that the conversion rates are actually worse at the top of the page than on the right side.
Google’s Chief Economist Hal Varian addressed this topic back in 2009, and while he found little variation in conversion rate by position, it would still be nice to confirm that this 5-year-old data is still true, and more importantly, that it applies to your business which is not average. The easiest way to get the data to make your case is in the Analytics Keyword Positions report.
Understand Your Segments
As Susan Waldes points out in her recent post on managing an account with 10 keywords, when you have one keyword that you’re managing, you’re really managing that keyword across potentially hundreds of segments. Understanding how each segment performs is crucial to making the right optimizations in your account.
The segmentations we all look at include dayparts, geographic regions and devices. While AdWords does an okay job making these segments accessible, GA does a better job, and with their advanced segment builder, you can do some really cool things.
For example, Google’s Digital Evangelist Avinash Kaushik explained how you could segment performance by the length of your keywords (scroll all the way to section 3 of his post) so that you could figure out if it’s really worth adding thousands of 6-word keywords to your account.
Last week, Google automated a segment we previously had to create manually that segments brand and non-brand keywords. You can now even build segments to analyze user cohorts, for example, to see what happens with users who first visited in July and saw a particular ad I was running then.

Create custom segments to take a deeper look at the data, and uncover if there are segments that aren’t performing as well as others.
Another great benefit of Google Analytics is that you can take any segment and turn it into a remarketing audience list in a single click.
Even though we all understand the power of looking at our data in a segmented way, the truth is that there are too many segments to analyze manually.
Analytics has an answer for that, too, and you can use the Intelligence Alerts to let Google do all the hard work for you. You can look at the report and see just data for AdWords, looking for either things that are unusual over a short period with daily alerts, or looking at longer trends using weekly or monthly reports.

Intelligence Events for AdWords automatically identify anomalies in the performance of your ads.
And That’s Why AdWords Is Better With Analytics
So those are 10 things I look at in Google Analytics to make better decisions in AdWords. Here’s the full list:
-
Use the “pages/visit” metric to see if users aren’t finding what your ads are promising
-
Look at “% new visits” and first-click conversions in search funnels reports to avoid deleting upper funnel keywords
-
Put a value on keywords that assist conversions with the Model Comparison report
-
Find landing pages that drag down your account’s performance
-
Track phone calls and video plays as conversions
-
See all conversions side-by-side in campaign reports in Analytics
-
Use the Goal Flow report to find where your AdWords clicks are falling off in the conversion process
-
Find the best performing position for your ads with the Keyword Positions report
-
Track cohorts and understand the value of long-tail keywords with custom segments
-
Find out quickly if any AdWords segments are underperforming with Intelligence Events
If I didn’t include your favorite report (and there are many more that are useful), be sure to share yours in the comments section.
Contributing authors are invited to create content for Search Engine Land and are chosen for their expertise and contribution to the search community. Our contributors work under the oversight of the editorial staff and contributions are checked for quality and relevance to our readers. The opinions they express are their own.
Related stories
New on Search Engine Land
About the author