3 Key PPC Metrics Are Lying To You. Find Out How
When it comes to PPC, metrics are everything. We consume ourselves in pouring over numbers and analyzing our accounts down to the smallest detail. However, it turns out we are being misled by the data we rely on the most. We’re too quick to take our figures at face value without thinking about what we’re […]
When it comes to PPC, metrics are everything. We consume ourselves in pouring over numbers and analyzing our accounts down to the smallest detail. However, it turns out we are being misled by the data we rely on the most.
We’re too quick to take our figures at face value without thinking about what we’re not seeing. I’m going to explore what I consider to be the three most misleading AdWords metrics (and discuss how we should be thinking about them differently): Click-Through Rate, Average Position and Average Cost-Per-Click.
Click-Through Rate (CTR)
Click-through rate (CTR) is the lifeblood of any good AdWords account. It is the primary way our ads are evaluated by Google, and it makes up the majority of our quality score. Given the importance of a good CTR, a lot of us still make the mistake of looking at our ad tests with the view that every click is equal.
We take a table like the one below and conclude that Ad 1 is the best ad. We’ll pause Ad 2 and then go write a couple of new ads to test against our winner.

Although Ad 1 does have a better CTR, that doesn’t necessarily mean it’s the best ad for all impressions. Turning off Ad 2 causes us to leave thousands of potential clicks on the table. We’re concluding our tests without segmenting our ads far enough.
Let’s look at five ways that CTR is currently being blurred in our AdWords accounts.
1. CTR Varies By Device
At SMX West, Brad Geddes mentioned that in a review of 250 million ads he conducted, only 3% were currently listed as “mobile preferred.” That number should be more like 50% (maybe a little less given that some of us don’t advertise on mobile). Why is this important? Because, there’s a good chance your best overall ad isn’t your best for both desktop and mobile. Take a look at this example from one of my accounts:
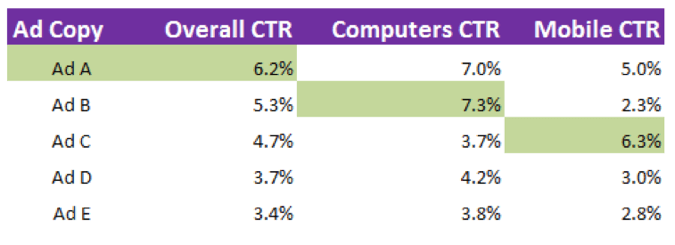
If we had separated our ads by device type, we’d be gaining a significant number of clicks over using only our “winning” ad.
2. Traffic From Google Search Vs. Search Partners
Traffic on Google and traffic on Google search partners are not the same thing. They’re just not. We need to stop looking at CTRs that combine the two. This mainly happens when I’m feeling too lazy to hit “segment” — the combined CTR is the default and it looks kind of like a number I should care about.
Search Partners (which I discuss in more detail below) can vary from large retailers’ websites such as Amazon, Walmart and Target to traditional search engines that mirror Google like Ask.com or AOL.
The CTR of ads showing on the Walmart website search page is so far removed from the CTR of ads on the Google search page that combining them removes almost all meaning from our ad tests.

3. Ad Position Impacts CTR
If your ad shows top of page, a lot of things happen. You get ad extensions like reviews and sitelinks. You also have an elongated headline if your description line 1 has punctuation at the end. These factors drastically change how your ads perform.
I’ve found that ads with punctuation at the end of line 1 perform about 9% better in the top positions, but perform worse on the side. This is because when I take all 70 characters to write a line of copy, I can write something more persuasive.
To fix this, segment your ads by top vs. other before making any decisions about which is your winner. If you’re being told you need to push for position 1, or need to cut bids, you’ll want to know if you should be switching to an ad that is better optimized for the position it’s going to be shown in.
4. Your Ad’s CTR Is Product Of Multiple Search Queries
How many of you have every single keyword in your account in its own ad group? I wish I did, but I don’t. This was highlighted to me as a problem recently when I tried to conclude an ad test in an ad group I have with 4 keywords:

Ad F was the overall winner on CTR. If I hadn’t segmented my ads by keyword (available in the segment drop-down), I’d have concluded the test and turned off every ad but ad F. However, for three of my four keywords, ad F wasn’t the best ad.
5. Some Ads Work Better On The Weekend
When you take an aggregate of your data, you are combining people searching before work, at lunchtime, on a slow Friday afternoon at work, and those sitting watching TV on a Sunday morning.
These are very different situations for people to be searching in. Their urgency, desire to buy, and overall place in the marketing funnel (e.g., researching vs. buying) will vary depending on time and day of the week.
At the very least, please judge your ad tests in multiples of seven to account for an even spread across the week. Even better is to pull your data with segments by hour of the day and day of the week.
Average Position
If you’re a bit lazy like I am, it can be tempting to simplify average position down to just a number. “My average position was 3.4 today; I should boost bids and maybe get up to 3.0. That way I can have my Sitelinks show!”
The first major issue with this comes in the form of the search partner problem (something my colleague Eric Couch did a great job explaining in a presentation recently).
Essentially, the scope of placements on the search partner network are so wide, that using any average position data that includes search partners is pretty much useless.
Let’s take a look at this ad that appeared in top position for [Xbox One].

Now, I decided to go to Amazon and use the site search function to search for the same thing again.

Take a look at the bottom of the page there, under Sponsored Links. Recognize that ad? Let’s zoom in on it for a closer look:
(Click to enlarge.)
It’s the exact same ad as the one above that appeared in the top position on Google Search. This ad, now in 16th position on Amazon, will record in AdWords as having impressed in first position. After all, it’s in first position for the Google results on Amazon!
However, you and I can both see that this position 1 is meaningless. If we have all of our ads showing in position 4.9 on Google SERPs and position 1 on Amazon, and we split impressions evenly between the two, we’d be under the mistaken assumption that our ads were getting top billing (and all the nice extension-related bonuses that go with that).
Another problem is that average position doesn’t tell us much more than (obviously) the average. To fully understand what is happening with our ads, we need to know more about where they are being shown. At the very least we want to see:
- The standard deviation. This tells us how far from the average our ads were distributed. Were our impressions clustered around the position AdWords is showing or did we have impressions in a much wider range of positions?
- The range our ads fall in. Is our 3.0 average position representative of our ads showing in 2, 3 and 4? Or did we have ads run from 1 to 10?
- The skew of our ads. Were our ads evenly distributed above and below the average? Did we have a lot of ads in positions 2 and 3 and then a long tail of impressions from 4 through 10?
This stuff is important because it tells us where the bulk of our impressions are coming from. If we’re getting 95% of impressions in 3rd place, our ads show ad extensions a lot more often than if we have a wide split from 1st to 5th.
What can you do to fix this? The first thing is to just exclude search partners when dealing with AdWords data (other than when specifically looking at search partner conversions and CPA).
The second is to use Top vs. Other as much as you would use average position. This helps with the problem of not knowing the range and standard deviation.
Average CPC
How do you make bid changes? The traditional formula is to set your Max CPC to your desired cost-per-conversion multiplied by your keyword’s historical conversion rate.
However, there’s one thing that throws a spanner into the works with this. The CPCs we bid for aren’t the amount we end up paying. Take a look at this example from one of my accounts of the average bid Max CPC and overall average CPC.
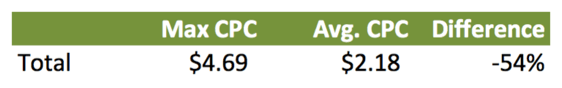
The question that you want to ask yourself then is should I just lower my bids by say 53%? Am I overbidding here? The answer is more complicated than you think. Let’s look at an example keyword. I’ve pulled our average position and CPC by hour of day (get this in your dimensions tab):
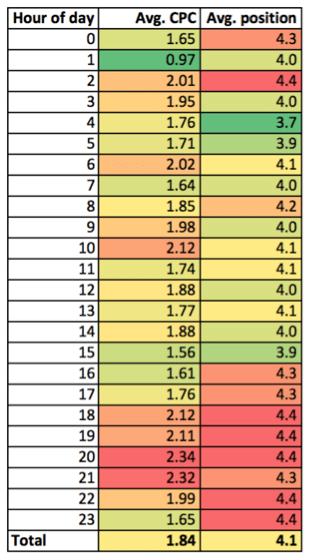
For this keyword, the range of our CPCs is $1.37 (from $0.97 to $2.34). Our competition are bidding higher in the evenings when users are more actionable and pushing us lower down in position. If I were to have cut my Max CPCs down to my average CPC, I would have taken a big hit in this key period of the day when my customers are buying.
That is, in essence, why you can sometimes take a big hit in conversions when you cut your bids by just a small percentage. Your average CPC gives you a false sense of security because it pulls in those clicks that might not cost you as much as the clicks you actually want. Again, segment by day, hour, search partners and device to get a clearer picture about what you actually should be doing with your bids.
Average CPC is a lie because it makes us think of CPC as a flat number. Really, we should be thinking about it as a curve, for which we need to know more about the standard deviation again. We control the top end of our CPCs (our Max CPC), but our competitors control the bottom end (the amount we actually end up paying). Once again, I’m going to link you to another great analysis by Eric that goes into more detail on this.
Final Thoughts
With all this in mind, I hope we can start to be more educated about what we’re actually doing when we pick ad test winners, or change keyword bids. Some of these revelations have helped us as an agency to find the particular changes we’ve made that have caused damage behind the scenes. I’d love to hear from you about how you judge tests, and how you decide on bids. As always, share away in the comments section below!
Contributing authors are invited to create content for Search Engine Land and are chosen for their expertise and contribution to the search community. Our contributors work under the oversight of the editorial staff and contributions are checked for quality and relevance to our readers. The opinions they express are their own.
Related stories
About the author