Averages Lie: A Guide To Understanding Increments & Bid Simulator
Suppose you run a banana stand. You buy pallets of bananas and sell them for $1.00/banana to poor saps in the airport. You normally buy bananas from Farmer Jones for $0.30 each. You have an additional $0.60/banana in expenses for delivery costs, storage, staffing, airport booth rental, etc, leaving you with $0.10 profit on each […]
Suppose you run a banana stand. You buy pallets of bananas and sell them for $1.00/banana to poor saps in the airport. You normally buy bananas from Farmer Jones for $0.30 each. You have an additional $0.60/banana in expenses for delivery costs, storage, staffing, airport booth rental, etc, leaving you with $0.10 profit on each sale.

One day, you go to Farmer Jones’ place and find that she’s out of town and has left her business in the hands of her crazy cousin Jimmy.
Jimmy says: “We only have 5 pallets of bananas left. I’ll sell you the first pallet at $0.10/banana; I’ll sell you the second pallet at $0.20/banana; I’ll sell you the third pallet at $0.30/banana, the fourth for $0.40/banana, and the last pallet will cost you $0.50/each since it’s the last one.”
How many pallets of bananas would you buy?
An argument could be made that buying all five would produce an average cost of $0.30/banana — the normal price — so that’s fine.
Another argument could be made that you don’t make any money selling the 4th pallet, and would actually lose money buying and selling the 5th, so stopping at 3 pallets makes the most sense.
Presented this blatantly, it would be hard to pull the trigger on that fifth pallet.
We face exactly this same choice in paid search, but the numbers are a bit harder to see.
We all know that the value of traffic coming through paid search varies tremendously by keyword, by time of day, by season, by stock position, and many other factors depending on the vertical. RKG, Google, and others who have studied the data carefully have found that the value of traffic does not vary significantly by position on the page.
{I am aware there will be a great outcry from those who believe certain positions are magic. All good, they’re welcomed to believe what they want, and maybe they have different types of clients than we’ve seen.}
The people who click on an ad in position 10 are equally likely to ‘convert’ after they get to the site as people who click on an ad in position 2, 3, or whatever. There will be fewer visitors and fewer conversions in position 10, but the value of the traffic is the same.
Hence, if the goal is to maximize conversions within some ROI constraint, then the goal of bid management is to pay a price for those clicks that corresponds to that anticipated value and let the position fall where it may.
This places us squarely in the banana dilemma. The price of each visitor at the top of the page will be higher than the price of each visitor at the bottom of the page, and since the value of each visitor is about the same, it is quite analogous to buying bananas at different prices.
Bid Simulator data makes this point crystal clear.

We see that the total cost rises as the traffic volume increases, and the upward ‘bend’ in the graph is a function of the average cost per click increasing as the bids get higher.
What this graph doesn’t show clearly is the increase in the incremental cost per click, but it’s simple to find it in the data.
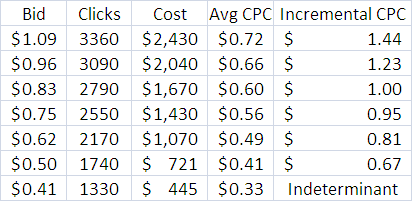
Let’s add two columns to the chart of data provided by bid simulator: 1) average cost per click at each bid; and 2) incremental cost per click at each bid, which is simply how much the additional clicks cost between that bid and the bid below it.
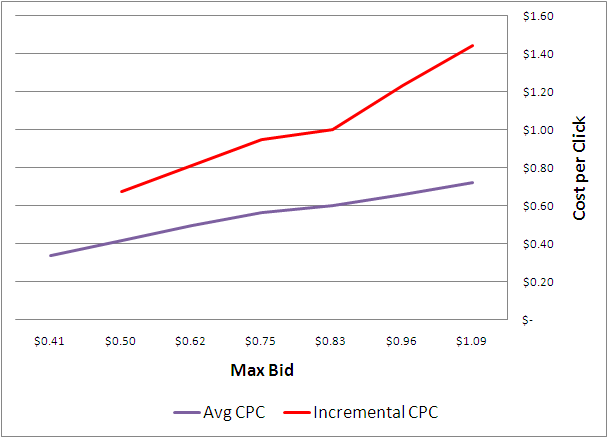
For those who prefer graphical presentations, below is a graph of average and incremental CPCs as a function of bid.
This data suggests that by bidding, say, $0.62/click we’d likely have paid an average CPC of $0.49/click for the previous week. But it also tells us that the additional 430 clicks obtained by bidding $0.62 instead of $0.50/click came at a price of $0.81/click!
The incremental CPC is actually higher than the Max CPC bid! This is not an anomaly, it is the norm.
How Does This Help Us Set Bids?
The answer depends on your goals for paid search. If the goal is profit maximization then, as Hal Varian effectively demonstrated, the right approach is to set bids such that the incremental cost of traffic is equal to the value of traffic on that particular ad.
If the value of traffic was $1/click then profit maximization would recommend a bid of ~$0.83/click. At that point, the total value of traffic generated minus the total cost of that traffic is at its zenith (2790 clicks = $2,790 in value, grabbed for a total cost of $1,670 yields a profit of $1,120).
Notice that the traffic difference between the $0.83 bid and the $0.75 bid is completely profitless, much like buying the 4th pallet of bananas from Jimmy. There are good arguments for buying it from a growth perspective, and Bradd Libby made a marvelous Machiavellian argument in favor of spending more rather than less as well.
If the goal of paid search involves more than profit maximization to include customer acquisition, top line growth, store support, and/or branding, this kind of marginal analysis is still tremendously valuable.
By determining a ‘drop dead’ incremental loss beyond which you will not go, smart marketers can rationally spend money, whether that money is a fixed budget or spent freely.
Using Bid Simulator Data At Scale
Using Bid Simulator data at scale is challenging, but not impossible. By pulling that data into our systems, we’re able to effectively build that incremental cost curve for each ad that has bid simulator data, and factor those curves into our bidding algorithm.
This needs to be done with some care:
- Bid Simulator data is only available for relatively high traffic, head keywords. The vast majority of keywords will have no bid simulator data, so the algorithm can’t depend on that piece of the puzzle. Moreover, using data about the head bid landscape to influence bids appropriately on the tail is not advisable in many situations.
- Bid Simulator data is a snapshot of the past. What happened last week does not necessarily reflect what will happen going forward. Indeed, if at some point using Bid Simulator data becomes the norm, advertisers may find themselves reacting to the same data signals as their competitors and end up creating a mess. Given the archaic state of bid management right now, I’m not too worried about this particular hypothetical.
- The data is limited in scope. We see only one piece of the bid landscape corresponding to seemingly random bid differentials above and below our average bid for the previous week. We haven’t identified rhyme or reason behind how far below our average bid or how high above the data will reflect, and it’s different for every ad.
- Extrapolating beyond the data provided is dangerous. By ‘building’ an equation of the line from the data table provided, it is easy to conjecture what the curve would look like beyond the information provided, but that’s dangerous business to say the least.
- Sophisticated campaign structures and bidding approaches can make using the data more challenging. Day-parting rules may impact bids quite significantly making the landscape provided out of scope for certain times during the week, and extrapolating is…well…dangerous if I haven’t mentioned it previously. Multiple versions of the same keyword (different match types, geo-targeting, syndication settings, etc.) mean decisions have to be made about whether it’s wise to apply what is true for one high traffic version to other versions.
Even with those warnings in mind, RKG went down this complicated path for a reason. Smart marketing means making decisions about how to spend the next marketing dollar, not the average marketing dollar. Bid Simulator data is not perfect, but when coupled with sophisticated attribution management, it gives us the clearest picture of what that answer is in paid search.
Contributing authors are invited to create content for Search Engine Land and are chosen for their expertise and contribution to the search community. Our contributors work under the oversight of the editorial staff and contributions are checked for quality and relevance to our readers. The opinions they express are their own.
Related stories
New on Search Engine Land
About the author