The Impact Of Google’s Quality Score Change
To assess the impact of Google’s recently-announced quality score change, I analyzed the pre/post change in Quality Score distribution across data for more than 100 advertisers. Since the exact range of scores differs for every advertiser, we looked at the percentage change in relative impression volume (proportion of total impressions) at each Quality Score level […]
 To assess the impact of Google’s recently-announced quality score change, I analyzed the pre/post change in Quality Score distribution across data for more than 100 advertisers.
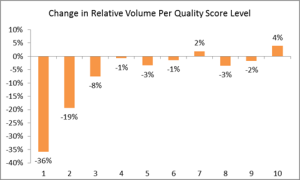
Since the exact range of scores differs for every advertiser, we looked at the percentage change in relative impression volume (proportion of total impressions) at each Quality Score level from 1 to 10.
I found that Quality Scores rose overall, with the proportion of 1s, 2s, and 3s decreasing significantly for many accounts, while the number of 10s increased.
For more data and illustrations, read the full article in Marketing Land’s Analytics & Marketing column.
Contributing authors are invited to create content for Search Engine Land and are chosen for their expertise and contribution to the search community. Our contributors work under the oversight of the editorial staff and contributions are checked for quality and relevance to our readers. The opinions they express are their own.
Related stories
New on Search Engine Land
About the author