True performance baselines & ROI for SEO without attribution modeling
How do you determine your SEO program's real performance, discounting the effects of seasonality, paid search spending or any other external factors? Columnist Chris Liversidge lays out a step-by-step process for reaching a reliable ROI calculation.

It’s an old trope of the Search Engine Optimization industry that SEO is the channel with the greatest return of any online marketing channel. But, given Google’s increased ability to identify and penalize sites employing poor-quality link-building practices, my experience in the new business trenches with QueryClick (my employer) tells me that many agencies today are failing to deliver return for their clients. And, in some cases, they report fantastic ROI figures despite presiding over declining organic traffic!
If you oversee SEO and want to get a true picture of your (or your agency’s) real return on investment improvement, what criteria do you need to use? Though this is a seemingly simple question, it’s a very important one to ask because SEO truly can — and should — be at the very core of your online marketing strategy.
So, what is my baseline?
Again, a seemingly simple question with an obvious answer: year-on-year improvement in revenue from the channel (independent of any attribution model). But let’s analyze what needs to come into the spotlight when building this baseline.
- Industry seasonality
- Adjust for one-off trend items. For example, smartphone retail traffic is affected hugely by Apple’s iPhone release cycle, even if you’re looking at the upgrade halo effect or refurbishment market impact. Equally, insurance markets, FMCG markets and luxury brand markets all have easily identifiable one-off trends you can account for and remove from your forecast baseline.
- Adjust for the expected external events that influence your category. Fashion is hugely affected by weather, for example, and if you know you’re in for early heat waves and disrupted winterwear demand in your target markets (Hello, 2016!), then make an assessment and adjustment. Make sure you record a note about this adjustment in your numbers, however (See below).
- Offline brand activity/paid media
- Adjust for (and annotate in your web analytics package) any spends across your paid media channels, including TV and radio, outdoor display, promoted posts, paid social and general paid search trends (See also much further below). You’re looking to remove year-on-previous-year variation.
- Earned & owned media
- As above, annotate and adjust for year-on-year variance in spends and discount values for earned and owned, for example, store discounting, promotional activity/aggressive online discounting, rewards for reviews (Make sure you are not doing this in 2016, BTW) and so on.
- Bear in mind we are looking for year-on-year variation. We have to start somewhere, so if you haven’t gone through this exercise before, take the previous year as your standard to start from, unless you have good reason not to (big data gaps, multiple new territories, changing from free to paid SAAS, removal of free delivery and so on). You may have to insert some manual adjustments here; this is perfectly acceptable, as rational thought and an attempt to be comprehensive and fair is the key here, not splitting the difference on minor variation.
- Market trend impact
- Are you in a growth market? If so, adjust to exactly counterweight this influence based on your accepted industry growth (revenue or spend industry figures). Same for declining markets. If you’re affected by this item, your business will already know what these figures are. If you don’t know, ask your finance folks.
- Keyphrase trend impact
- This is interesting, as it assumes intent, and as such, it does not make my list for adjustable components. For example, say you happen to be on trend for the fashion fad of the year (gold lamé baggy trousers, say), is it fair to remove that from your baseline? Well, I’d argue if you have stormed the SERPs with awesome rankings for that term, and fashion follows your farsighted decision, then you should reap the benefit of that. After all, if you don’t, you’d then have to remove the decline in traffic for previously popular terms. You’re not trying to remove the effect of strategic decisions from your SEO performance calculations. This is about removing external, unearned influences.
- Historic trend impact
- This is simply taking a view of the “state of play” performance of the site based on a two- or three-year historic view and including this as part of your baseline against which performance improvement and ROI calculation are measured. This is important, as it allows assessment of your improvement over and above your “status quo” activity. You could argue that this is an overly harsh view to take: in essence, you are obliging better performance before any ROI calculation because you are taking the previous year’s performance improvement away from your upcoming year calculations. But if there is to be any purpose to your ROI metric beyond comparing it to a third-party performance (and that would be better done by comparing flat revenue growth, or not at all, if you aren’t performing full attribution analysis), then you should consider this improvement on the status quo to be the very key to what you’re trying to achieve. To allow leeway, call ROI that’s calculated using this approach “Incremental ROI,” and also calculate unadjusted ROI to allow for context. Performing this calculation requires forecasting forward the expected performance given the historic data in a statistically significant way. We use ARIMA modeling at QueryClick, which has proven very effective.
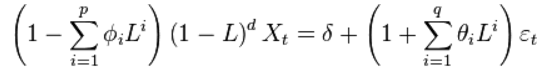
This defines an ARIMA(p,d,q) process with drift δ/(1−Σφi)… but you don’t need to know that. Apply a data scientist to R and automate this part.
Keep all your adjustments available and clear in your baseline, and pull in the R data from your ARIMA calculation. In Excel, for example, instead of stacking up all of the above, keep the modifiers for each item separate — I like to run a separate tab — and place your modifiers in month-by-month grids, adjusting up and down by percentage rates based on the absolute difference and total volume affected. If you keep it all in a separate sheet, you can review and assess against the reality and include commentary when you set out your baseline.
If you are applying this adjustment historically (and I strongly recommend you do, even if you are going through this process for new campaign planning and to secure budget), take the same approach and place confidence rates (zero to 100 percent) against each item. These can be set to 100 percent for items you are certain affected the baseline (stuff in the past, say). For example, in the UK, we have had four consecutive “hottest months ever” this year. If your data covers this period, you have a 100 percent modifier to your early/late sales impact rate (itself a percentage).
If there is a level of doubt about a modifier you insert, try to use modifiers that are widely accepted in the business category or industry, and, where none exist, take a moderate view and use that year’s data to assess if the modifier needs to change next year. This narrative continuity, and declaration of “known unknowns” will engender confidence in your baseline stability and remove subjective influence — allowing you to take an objective view of performance over and above this baseline.
Also, annotation within your web analytics package is a best practice to ensure any segmentation and subsequent data export can take your data in context and allow adjustment.
Attributing value within an attribution model
Attribution is, itself, an in-depth post, so, other than asking you to think deeply about Avinash Kaushik’s excellent primer, let’s restrict ourselves to the most pertinent and independently measurable facet of attribution as it relates to SEO year-on-year performance: How much has SERP overlap affected SEO channel traffic capture year-on-year?
Answering this requires us to adjust for spend variation in paid search over the year, and also to deal with the old issue of brand and non-brand conversion impact. In short, brand typically converts at a higher rate on last-click attribution models, which then takes revenue (unfairly) away from other channels which contributed to the brand search in the first place.
Another way to think about this issue is that the time to convert is lower for brand traffic compared to non-brand, and so traffic via non-brand appears “harder to convert.”
For our SEO baseline, we can account for this by simply adjusting to:
- overall paid search spend adjustment (Again, we adjust month-on-month by a percentage rate based on variance with the same month for the previous year.); and
- brand vs. non-brand split.
The importance of the first of these items is self-evident. Increased paid listings where once there were only organic for your brand will impact organic traffic (regardless of any incremental halo effect where both exist) and should be removed from our baseline measurement for fairness in the same manner as the previous items. The second is less evident.
The theory it models is: if SEO is to drive new business (as opposed to cannibalizing other channels), and if we are trying to measure growth, then increases in non-brand traffic should be critical and weighted up.
Therefore, in determining our baseline, we should weight-up the value of non-brand traffic and depress the impact of any brand increases. This further limits the impact of external factors and rewards the capture of highly valuable new business that would not otherwise have engaged if our ranking had not existed.
Adding this into your baseline requires an understanding of the brand versus non-brand split in your paid and organic data, which I described in my previous article on building lightweight attribution models for paid and organic media mix analysis.
Returning the “true” ROI
At this stage, we have normalized for many of the unearned components that contribute to the performance of any metric assessed from organic search. Obviously, to calculate ROI, you will need a value for Revenue (or Net Revenue). Taking a historic view, we can assess the previous year’s Net Revenue from our normalized baseline: this is the “R” in our ROI calculation and should be used for the calculation.
If you are managing an internal team, you must decide how much to weight up the influence of increased generic performance to counterweight the stark reduction of trend performance you are removing with all the above normalization With a new or growing team, you may want to down-weight the trend performance as encouragement for future performance. With a more experienced team, you could be more stringent and allow for more “carryover” performance from the previous year.
Regardless of your decision, you now have the tools and a solid methodology for why you are calculating ROI figures that will allow you to interact more meaningfully with the rest of the business. Normalizing SEO ROI enables you to to be closer to the measurement protocols used with other business activities.
Contributing authors are invited to create content for Search Engine Land and are chosen for their expertise and contribution to the search community. Our contributors work under the oversight of the editorial staff and contributions are checked for quality and relevance to our readers. The opinions they express are their own.
Related stories
New on Search Engine Land
About the author