Drilling Into Top Conversion Paths For Valuable Insights
Getting the whole story from your analytics is always a work in progress. Not only do we need to look at user behaviors (or the lack thereof), we need to look at user experience interaction as well as revenues. One mistake I see many novice and new-to-analytics marketers fall into is ending their research path […]
Getting the whole story from your analytics is always a work in progress. Not only do we need to look at user behaviors (or the lack thereof), we need to look at user experience interaction as well as revenues.
One mistake I see many novice and new-to-analytics marketers fall into is ending their research path at the Revenue report in the E-commerce section of Google Analytics. While knowing how much revenue your products are generating is important, there’s more than just direct revenue. While the argument can, and should, be made for engagement being a form of ROI, I’m actually referring to referral paths and assisted conversions.
I think the information contained in the reports below the “E-commerce” section is important, but perhaps can be confusing; really, anything in the multi-channel funnel section of the site is pretty intimidating to a novice analytics user. I’d like to take some of the confusion out of these reports in an effort to encourage beginners to delve into their information more often.
Your Top Conversion Paths
First, be aware that interactions are just that, interactions – a user might have more than one sales interaction in any given period of time. This is useful data, but you cannot just add these numbers to your revenue numbers and get a number. It doesn’t happen that way. You do need to be aware of these numbers, though. Understanding that visitors use many different ways to reach your website before they buy is an important step toward understanding what channels drive useful traffic
Looking at your channel traffic and your top conversion paths can help clear up where important traffic comes from. I don’t think people quite understand what a conversion path looks like until they see this. Seeing evidence of the different methods people use to find a site really opens eyes to the importance of a varied approach to your online marketing.
For instance, paid advertising can support organic placement and conversions. Social media can be the doorway for a new user to find your brand, and supports paid, organic, and direct revenues. There are many different ways to look at the data. The standard overview tells a good story.
Using Filters To Drill Into The Data
If we drill into the data – we can see even more. Use the filter feature to look at any path that includes a specific channel. I can see how much revenue involved an organic click, or a social media referral – that’s important data to have when you’re trying to convince accounting, or the c-suite, that it’s worth the investment. Many times, in-house or agency account managers need ammunition to defend their desire to play in more than just one or two fields. This report helps us do that – and includes the revenue numbers that correspond to these channels.
Just looking at the first page of the standard report itself can tell a small portion of the story, but digging in and filtering the data can tell us so much more. The first page of the standard report is impressive – it shows a variety of channel paths:
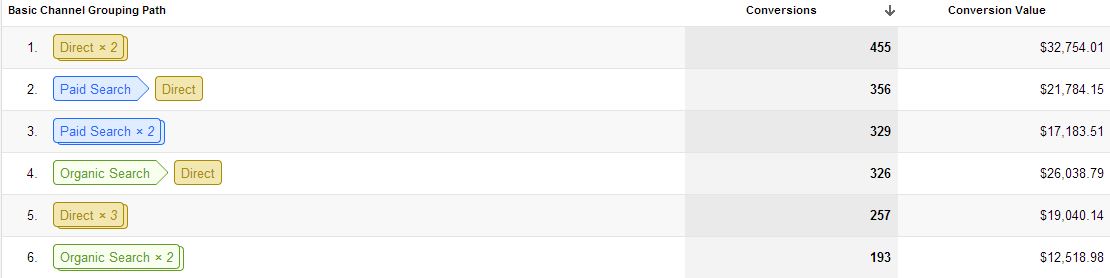
But, if we just look at the first page, we have no idea which channels included a social network referral that sent nearly $5,000 in revenue during the month – that’s a significant chunk!

We can take the data here a step further and look at which social networks are assisting the conversions by drilling into the data. From the Top Conversion Path report, add a secondary dimension for “Source Path.”
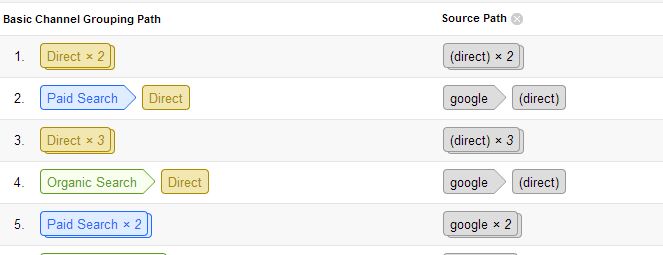
Adding Secondary Dimension Filters
Now that we can see the grouping path, and the source path – we see the actual websites included in the organic, paid, social, and referral clicks in the secondary dimension. There are hundreds, if not thousands of paths – so we need to filter to group things together a bit more. We’ll use the advanced search function to do this. Click on Advanced next to the search box and create an advanced search that looks like this:
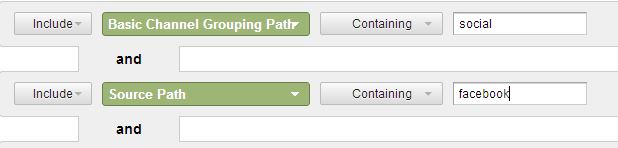
We can now see every conversion that contained a social network component, and group them together by social network. Filter by only the “Basic Channel Grouping Path” of “Social” if you want to see all conversions that included a social network click; add the second dimension of “Social Path” if you want to see the data for a specific social network. Below, we see the conversion paths that contained a Facebook click.
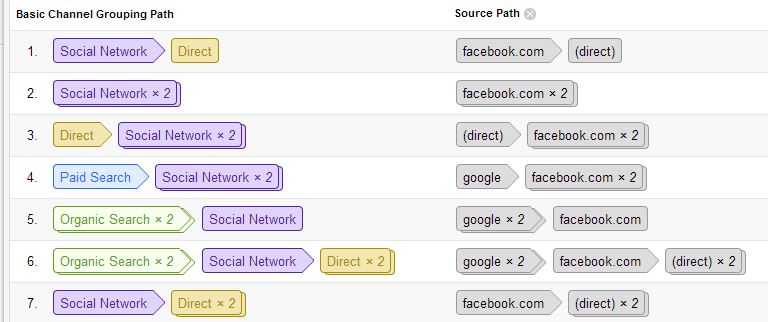
You can change the source path to Twitter or Pinterest – whichever network you want to explore, and click Apply. Now, you see every conversion path that contains a Facebook click.
You can complete these same steps to see Paid Search channels by engine, or organic. You can make your secondary dimension a keyword and see how keywords and organic search assist in future sales. Sometimes, standard data is enough to tell us whether a keyword or a referral is worth it; sometimes, we need to dig a little deeper to see the whole story.
Contributing authors are invited to create content for Search Engine Land and are chosen for their expertise and contribution to the search community. Our contributors work under the oversight of the editorial staff and contributions are checked for quality and relevance to our readers. The opinions they express are their own.
Related stories
New on Search Engine Land
About the author