Google 10-Q Filing: AOL Investment “Impaired,” And Other Tidbits

Gary Price alerted us yesterday to Google’s 10-Q filing. There’s lots of stuff in there worth drilling into. The headlines this morning, however, concern Google’s statement that it thinks it’s not going to get full value from its previous $1 billion, 5 percent AOL investment several years ago.
Here’s the statement in the filing:
We review our investment in AOL for impairment in accordance with FSP SFAS 115-1, The Meaning of Other-Than-Temporary Impairment and Its Application to Certain Investments (“FSP 115-1”). Based on our review, we believe our investment in AOL may be impaired. After consideration of the duration of the impairment, as well as the reasons for any decline in value and the potential recovery period, we do not believe that such impairment is “other-than-temporary” at June 30, 2008 as defined under FSP 115-1. As a result, our investment in this non-marketable equity security is carried at cost on our Consolidated Balance Sheets. We will continue to review this investment for impairment in the future. There can be no assurance that impairment charges will not be required in the future, and any such amounts may be material to our Consolidated Statements of Income.
In its recent second quarter earnings release, TimeWarner reported that AOL revenues declined “16% ($196 million) to $1.1 billion, reflecting a 29% decrease ($200 million) in subscription revenues, offset in part by a 2% increase ($8 million) in advertising revenues.”
Google’s investment came with an AOL valuation of $20 billion. AOL is now being split into two businesses and readied for partial or complete sale. It’s likely that the company isn’t worth more than $10 billion in total, but we’ll see if and when any transactions occur.
Here are some tables from the Google 10Q filing:
Revenue by source:
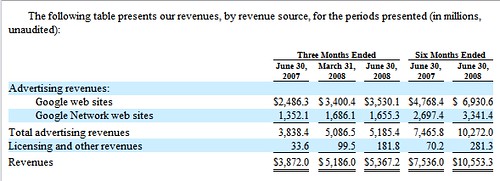
Note the significant increase in licensing revenues. Google’s explanation is as follows: “The majority of this additional revenue consists of fees derived from DoubleClick’s online ad serving and management services.”
Geographic distribution of revenues:
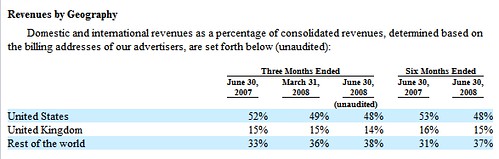
Note that ROW is driving a higher percentage of Google’s revenues now than a year ago.
Allocation of costs and profit margins:
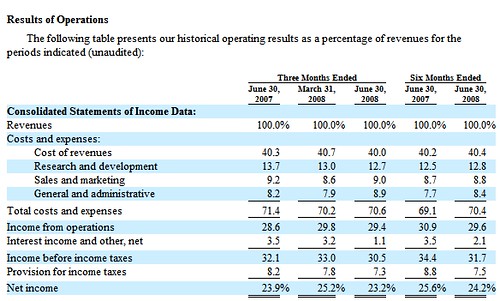
R&D is flat, sales and marketing expenses have increased somewhat (but are down vs. a year ago), and Google’s net is just over 24 percent and up vs. a year ago.
Explore more on
Add Search Engine Land as a preferred source on GoogleEditorial disclosure
Contributing authors are chosen for their expertise and work under the oversight of the editorial staff. Search Engine Land is owned by Semrush. The contributor was not asked to mention Semrush; the opinions expressed are their own.
About the author