Google Analytics Now Data Sampling: What’s The Catch?
Google made a significant event out of Leap Day 2012 by releasing a new version of Google Analytics featuring Data Sampling. The idea behind data sampling is commonplace in any statistical analysis: in order to get results faster, you analyze a sub-set of data to identify trends and extrapolate aggregate results based on the percentage […]
Google made a significant event out of Leap Day 2012 by releasing a new version of Google Analytics featuring Data Sampling. The idea behind data sampling is commonplace in any statistical analysis: in order to get results faster, you analyze a sub-set of data to identify trends and extrapolate aggregate results based on the percentage of overall traffic represented in the sub-set.
While I’m not a huge fan of sampling data when not necessary, larger data sets put a significant load on servers and sampling becomes a necessary evil when trying to deliver quick high on high volume data sets. As a result, I’m a fan of how the GA team has integrated data sampling into reporting.
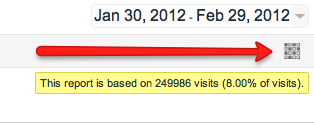
On the custom reporting tab there is a new button resembling a checkerboard. Below the button is the sample size.

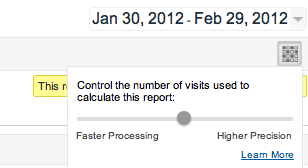
To adjust the sample size, click on the checkerboard button to populate a sliding scale going from “Faster Processing” on the left to “Higher Precision” on the right.
Faster processing uses a smaller sample size, delivering results more quickly. Higher precision uses a larger sample size for more accurate reporting.
As with any data sampling process, the smaller the sample size the greater the margin of error due to the assumption that the sub-set of data reflects the trends of the aggregate data set.
This is a significant change in how we can read into data sets as 1) it gives analysts a mechanism for more real time insights as the data aggregation takes several hours before being made available in the interface; and 2) the integrity of data can be put into question due to statistically insignificant sample sizes.
When Does Sampling Occur?
As noted in the “Learn More” link under the sliding scale, sampling automatically occurs “By default (until you use the slider to change your sampling preference)…when report data exceeds 250,000 visits. However, you can use the slider to increase this threshold to as high as 500,000 visits…Sampling in Multi-Channel Funnel reports automatically occurs when the data includes more than 1 million conversion paths, regardless of your sampling preference setting.”
How Will This Affect My Data?
In short, you will lose clarity and there is the potential for misleading insight if the sample size is too small. If you have an account and run reports with more than 500,000 visits, your data sets will be truncated and assumptions made be made.
Is this cause for alarm? Yes and no. So long as Google delivers statistically significant data samples, then there is no cause for alarm. However, this feature is new and it’s unclear how statistically significant the data samples are. If you require no sampling you’ll need to run reports with less than 500,000 visits.
As noted above, one exception to the 500,000 visit limit is in multi-channel funnel reporting. Multi-channel funnels will be sampled once the number of paths exceed 1,000,000.
To be frank, 1,000,000 conversion paths is a lot of conversions and there aren’t that many companies out there who are pulling in more than 1,000,000 conversions in a relevant time frame (given seasonality; if you are one of these companies, I suggest the paid version of Google Analytics or another solution to mitigate the issue).
As a result, I don’t expect the relevancy of multi-channel conversion funnel reporting to be impacted by data sampling.
If anyone has already analyzed the effects of data sampling on the relevance of their reporting please feel free to comment below. I will be following up once I have enough relevant data to share.
Contributing authors are invited to create content for Search Engine Land and are chosen for their expertise and contribution to the search community. Our contributors work under the oversight of the editorial staff and contributions are checked for quality and relevance to our readers. The opinions they express are their own.
Related stories
New on Search Engine Land
