35 up-to-date ecommerce statistics
Ecommerce has transformed the retail landscape. In fact, ecommerce is forecasted to capture 22.5% of retail sales worldwide by 2028.
From the convenience of fast and free shipping to wide product choice, more consumers opt to shop online.
To help you learn about the dynamic landscape of online shopping, we’ve curated a list of recent ecommerce statistics to know.
Let’s dive right in.
General ecommerce statistics
What’s the share of ecommerce in retail sales worldwide and in the US? What are the top ecommerce categories? In this section, we’ll cover recent stats on retail ecommerce sales worldwide and in the US.
Retail ecommerce sales worldwide are estimated to reach $6.42 trillion in 2025, which is a 6.86% year-over-year increase (eMarketer).

Here’s a detailed breakdown of retail ecommerce sales growth since 2022:
| Year | Retail Ecommerce Sales Worldwide |
|---|---|
| 2022 | $5.09 trillion |
| 2023 | $5.58 trillion |
| 2024 | $6 trillion |
| 2025 | $6.42 trillion |
| 2026 | $6.88 trillion |
| 2027 | $7.38 trillion |
| 2028 | $7.89 trillion |
Ecommerce accounts for 20.5% of total retail sales worldwide in 2025. Ecommerce share in global retail sales is forecasted to reach 22.5% by 2028 (eMarketer).
Here’s a table with ecommerce share of total retail sales worldwide since 2022:
| Year | Retail Ecommerce Worldwide (% Share of Total Retail Sales) |
|---|---|
| 2022 | 18.5% |
| 2023 | 19.3% |
| 2024 | 19.9% |
| 2025 | 20.5% |
| 2026 | 21.1% |
| 2027 | 21.8% |
| 2028 | 22.5% |
Retail ecommerce sales in the US amounted to $1.19 trillion in 2024, up from $1.01 trillion in 2022 (U.S. Census Bureau).
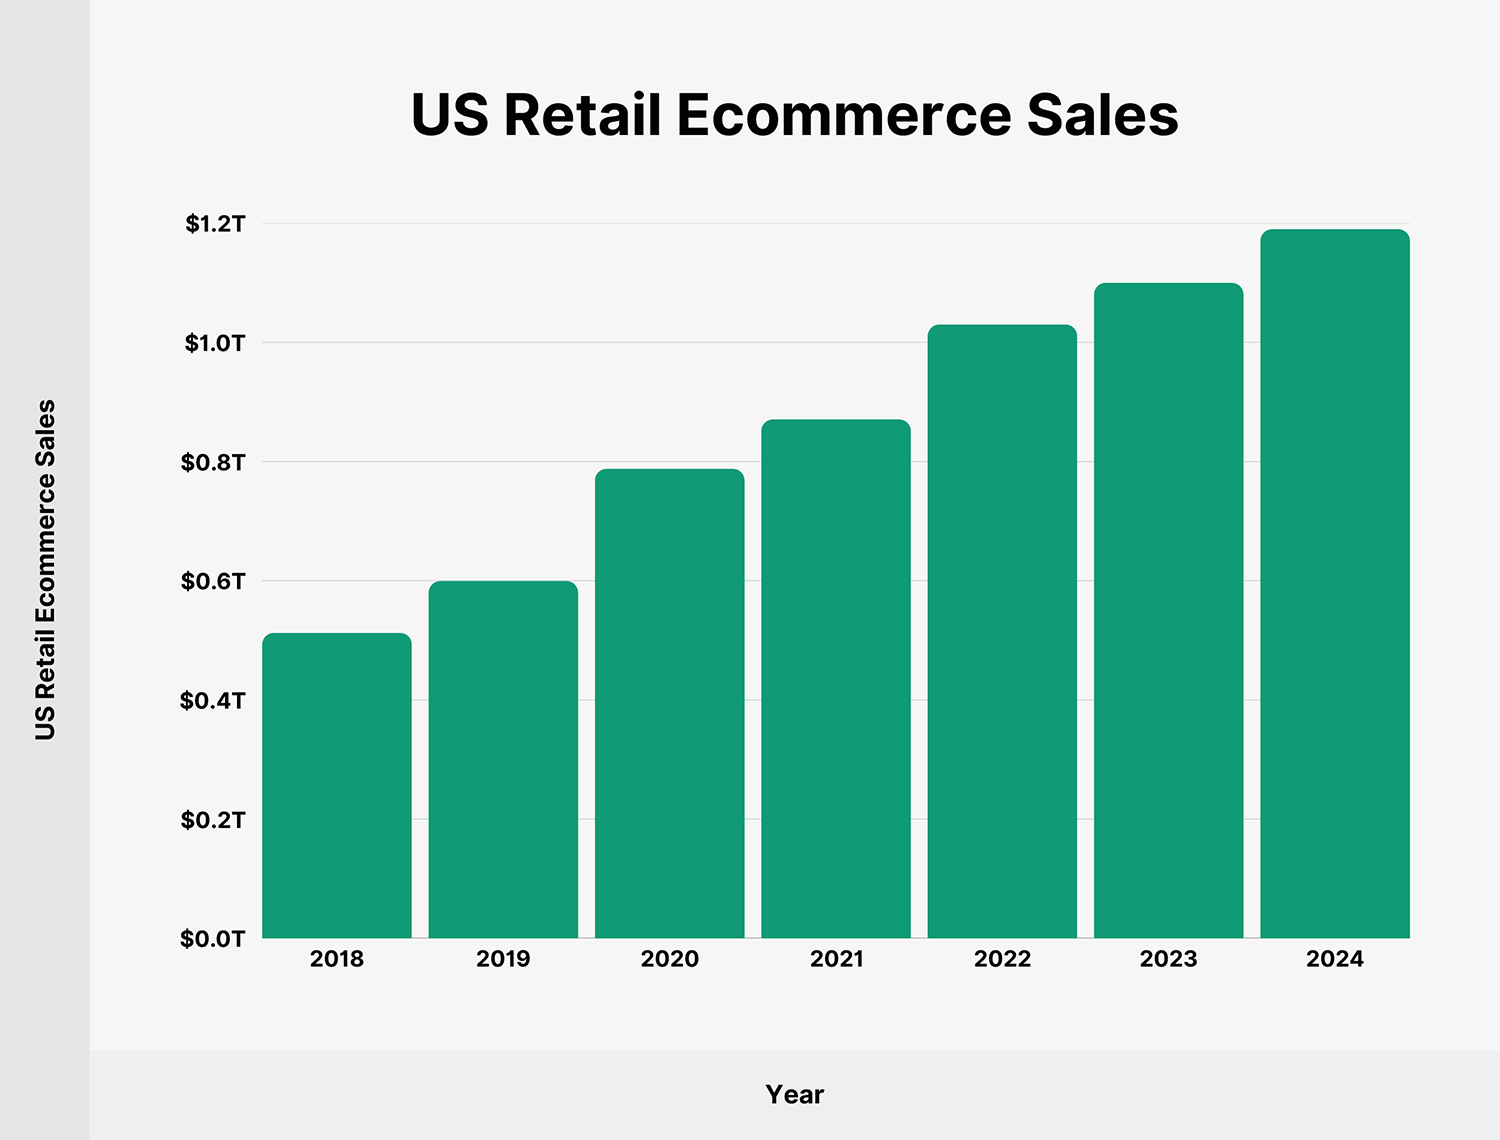
Here’s a detailed breakdown of US retail ecommerce sales since 2018:
| Year | US Retail Ecommerce Sales |
|---|---|
| 2018 | $512.57 billion |
| 2019 | $599.51 billion |
| 2020 | $787.93 billion |
| 2021 | $870.71 billion |
| 2022 | $1.03 trillion |
| 2023 | $1.1 trillion |
| 2024 | $1.19 trillion |
As of 2024, ecommerce represents a 16.13% share of all retail sales in the US (U.S. Census Bureau).

Here’s a table with ecommerce share of US retail sales since 2018:
| Year | US Retail Ecommerce (% Share of Total Retail Sales) |
|---|---|
| 2018 | 9.63% |
| 2019 | 10.97% |
| 2020 | 14.02% |
| 2021 | 13.22% |
| 2022 | 14.54% |
| 2023 | 15.28% |
| 2024 | 16.13% |
Amazon accounts for 40.9% of total retail ecommerce sales in the US, representing $540.29 billion in gross sales in 2025. To put it in perspective, Walmart’s retail ecommerce sales amounted to $93.86 billion in 2025 (eMarketer).
| Year | US Amazon Retail Sales | Share of Total US Retail Sales |
|---|---|---|
| 2020 | $309.48 billion | 37.9% |
| 2021 | $364.55 billion | 38.0% |
| 2022 | $398.13 billion | 38.3% |
| 2023 | $444.76 billion | 39.6% |
| 2024 | $491.65 billion | 40.4% |
| 2025 | $540.29 billion | 40.9% |
Amazon, eBay, and Walmart are the top 3 most popular ecommerce sites ranked by US monthly visits as of November 2023 (eMarketer).
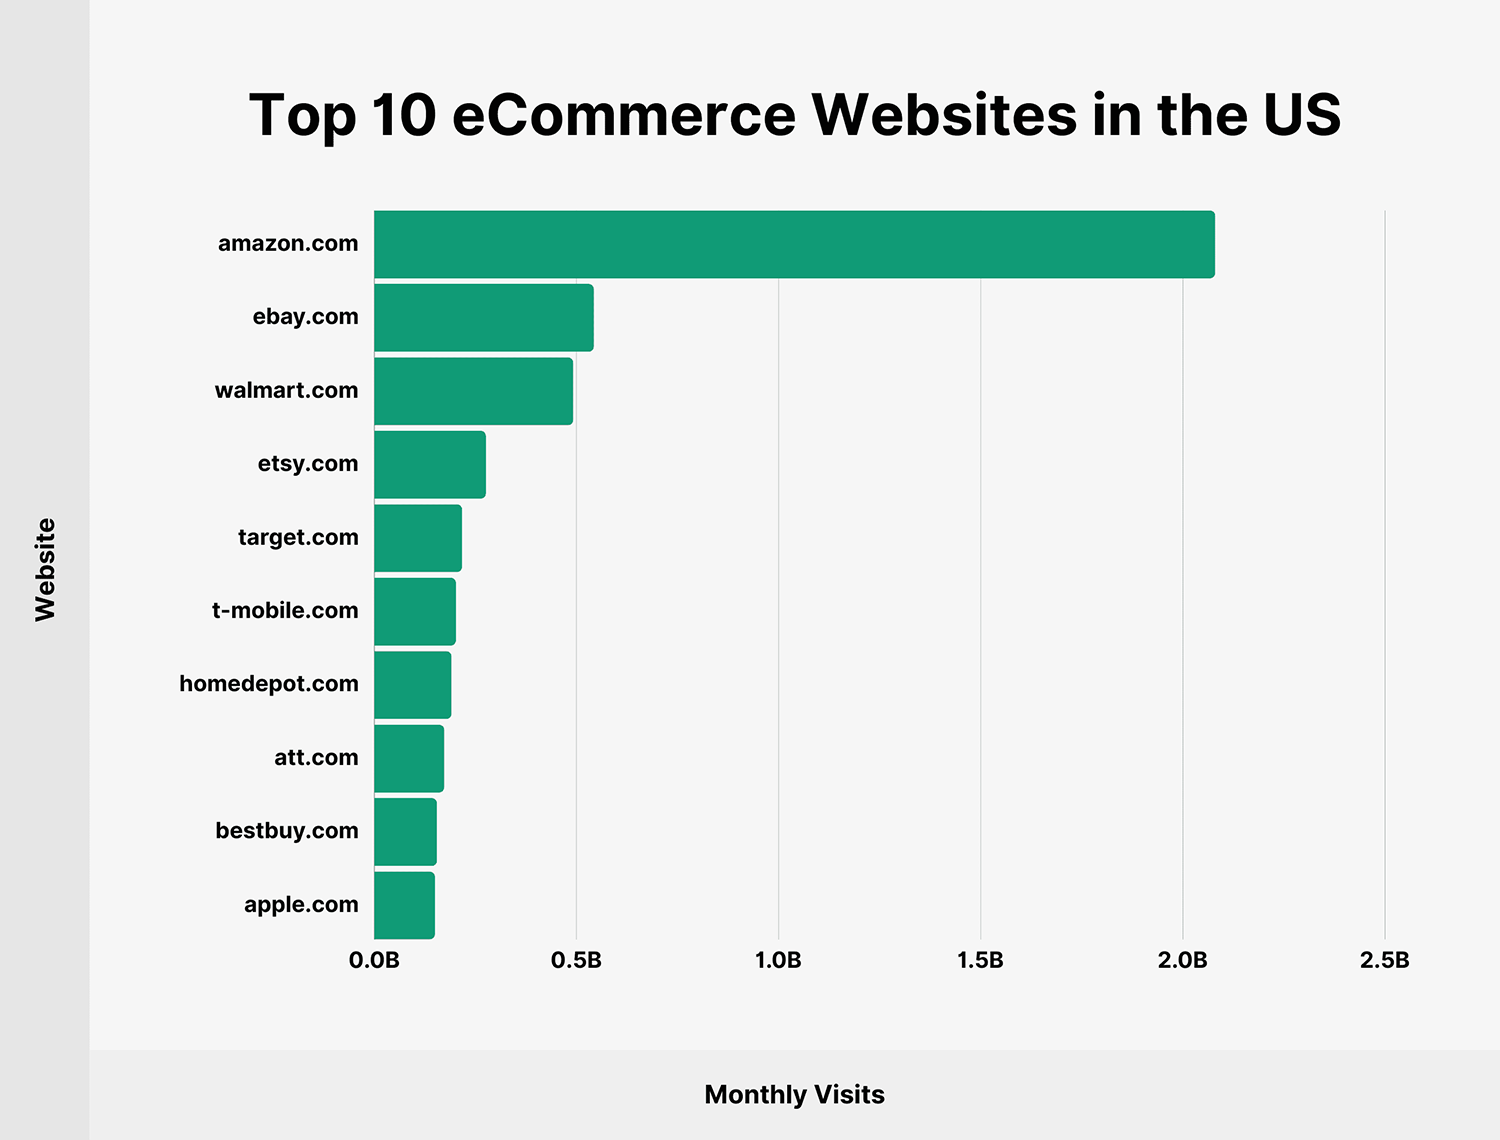
Here’s a full ranking of top 10 ecommerce websites in the US ranked by number of monthly visits:
| Website | Monthly Visits |
|---|---|
| amazon.com | 2.08 billion |
| ebay.com | 543.8 million |
| walmart.com | 492.7 million |
| etsy.com | 276.2 million |
| target.com | 217.4 million |
| t-mobile.com | 202.3 million |
| homedepot.com | 191.0 million |
| att.com | 173.8 million |
| bestbuy.com | 155.9 million |
| apple.com | 150.3 million |
By 2026, grocery is forecasted to be the largest ecommerce category in the US, accounting for 19.0% of ecommerce sales, closely followed by apparel and accessories (18.7%), computer and consumer electronics (15.5%), and furniture and home furnishings (14.6%) (eMarketer).
Clothing, shoes, and beauty products are the top 3 digital purchases in the US (eMarketer). Here’s a complete list of the most popular digital purchases in the US:
| Product Category | Share of US Digital Buyers (who made a purchase in the past month) |
|---|---|
| Clothing | 67.1% |
| Shoes | 44.0% |
| Beauty products | 43.1% |
| Food and beverages (non-alcoholic) | 41.8% |
| Household supplies | 40.9% |
| Toys and games | 37.1% |
| Books, music, and videos | 36.7% |
| Pet products | 35.7% |
| Pharmacy and health | 35.3% |
| Accessories | 31.8% |
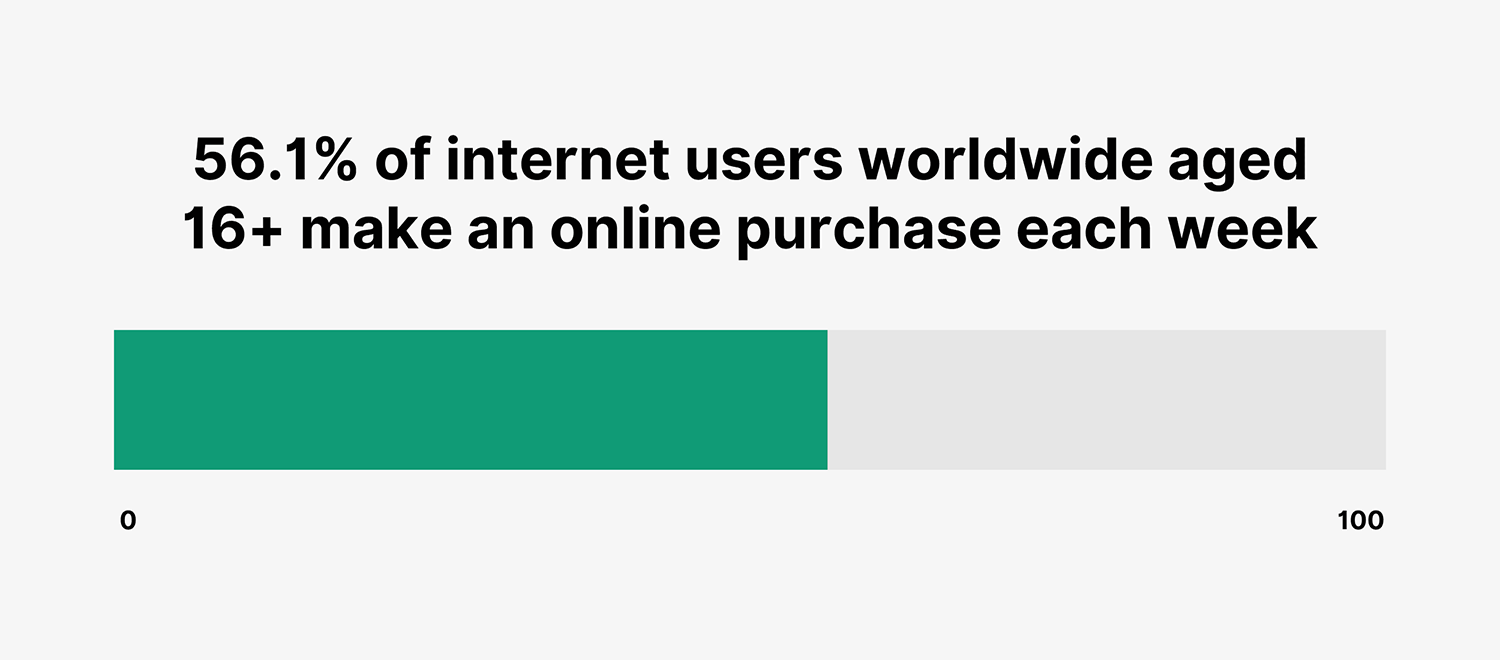
56.1% of internet users worldwide aged 16+ make an online purchase each week (DataReportal).
On average, annual spending per online shopper worldwide reached $1,620 in 2024. In the US, the average online spend per buyer is $4,470 (DataReportal).
Electronics is currently the largest consumer product category with the most ecommerce spending, accounting for $771 billion in sales in 2024 (DataReportal).
Here’s a detailed breakdown of the largest product categories by annual consumer spending in the US:
| Product Category | Annual Ecommerce Spending (B2C only) |
|---|---|
| Fashion | $771 billion |
| Food | $680 billion |
| DIY & Hardware | $494 billion |
| Electronics | $465 billion |
| Physical Media | $439 billion |
| Furniture | $283 billion |
| Beverages | $236 billion |
| Beauty & Personal Care | $227 billion |
| Tobacco | $171 billion |
| Household Essentials | $123 billion |
| Toys and Hobby | $116 billion |
| Over-the-counter Pharmaceuticals | $82.5 billion |
| Eyewear | $30.1 billion |
Online shopping behavior statistics
What are the online purchase drivers? Why do consumers abandon their shopping carts? In this section, we’ve curated a list of online shopping behavior statistics to answer these questions.
Free delivery (50.5%), coupons and discounts (39.1%), and customer reviews (32.1%) rank as the top 3 online purchase drivers among internet users worldwide (DataReportal).

Here’s a complete ranking of online purchase drivers:
| Factor | Share of Internet Users |
|---|---|
| Free delivery | 50.5% |
| Coupons and discounts | 39.1% |
| Customer reviews | 32.1% |
| Easy returns policy | 31.2% |
| Simple online checkout | 27.7% |
| Next-day delivery | 27.6% |
| Loyalty points | 24.7% |
| Social likes and comments | 22.3% |
| Eco-friendly credentials | 18.3% |
| Interest-free payments | 16.9% |
| Cash on delivery | 16.7% |
| Influencer recommendations | 15.1% |
| Exclusive content or services | 13.9% |
| Click and collect | 13.6% |
| Guest checkout | 13.2% |
48% of US consumers state that their main reason for abandoning shopping carts during checkout is high extra costs (shipping, tax, fees). Other common reasons include a requirement to create an account (26%) and security concerns about sharing credit card information (25%) (Statista).
Here’s a complete list of popular reasons why US consumers abandon their shopping carts:
| Reason | Share of Respondents |
|---|---|
| Extra costs too high (shipping, tax, fees) | 48% |
| Requirement to create an account | 26% |
| I didn’t trust the site with my credit card information | 25% |
| Delivery was too slow | 23% |
| Too long / complicated checkout process | 22% |
| I couldn’t see / calculate total order cost up front | 21% |
| Returns policy wasn’t satisfactory | 18% |
| Website had errors / crashed | 17% |
| There weren’t enough payment methods | 13% |
| The credit card was declined | 9% |
For 43% of US Gen Z consumers, marketplaces were a starting point in their online shopping journeys in 2024. Another 24% of online shoppers stated use of search engines, followed by a preferred brand’s website (18.5%) and social media (12.5%) (Attest).
More than 7 in 10 US adults believe home delivery, free shipping, and in-stock products are necessary online shopping attributes for convenience (eMarketer).
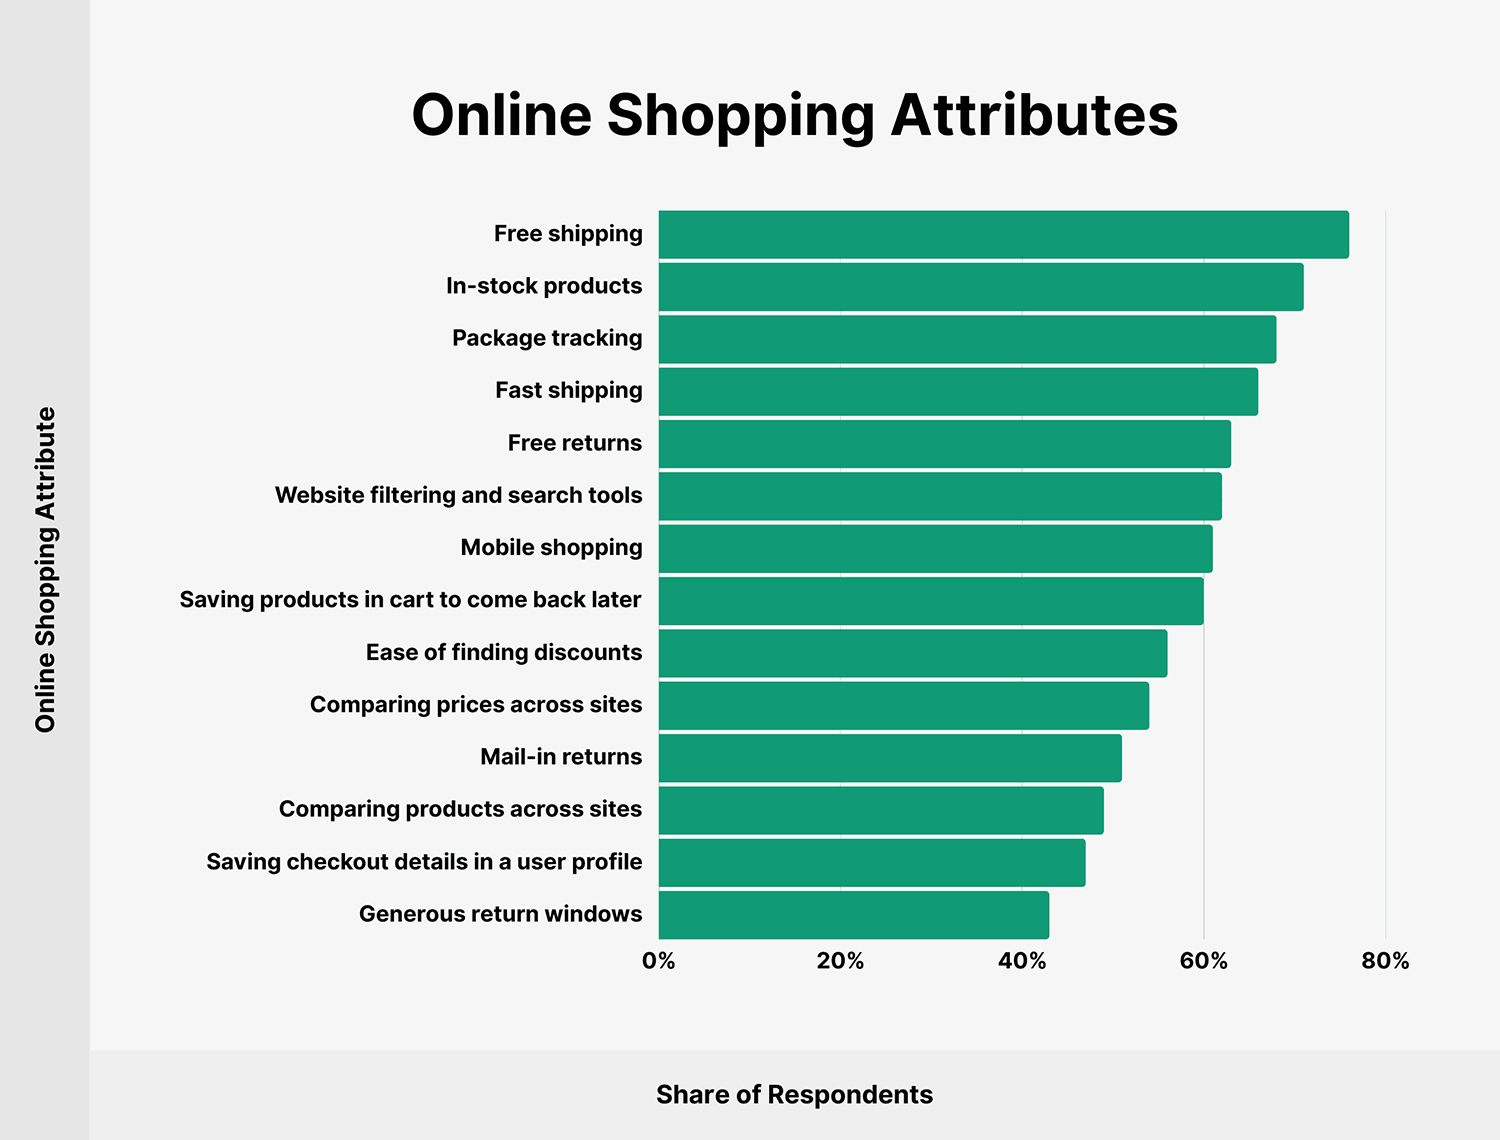
Here are the exact numbers:
| Online Shopping Attribute | Share of Respondents |
|---|---|
| Ordering for home delivery | 81% |
| Free shipping | 76% |
| In-stock products | 71% |
| Package tracking | 68% |
| Fast shipping | 66% |
| Free returns | 63% |
| Website filtering and search tools | 62% |
| Mobile shopping | 61% |
| Saving products in cart to come back later | 60% |
| Ease of finding discounts | 56% |
| Comparing prices across sites | 54% |
| Mail-in returns | 51% |
| Comparing products across sites | 49% |
| Saving checkout details in a user profile | 47% |
| Generous return windows | 43% |
66% of consumers cite free shipping as a key online shopping feature (PYMNTS).
5 in 10 consumers take into account the ease of checkout process on a retailer’s website or app when deciding where to shop online (PYMNTS).
As of March 2025, the average shopping cart abandonment rate worldwide is 76.22% (Dynamic Yield).
Nearly 4 in 10 (39%) of US consumers say they have already used generative AI while shopping online (Adobe).
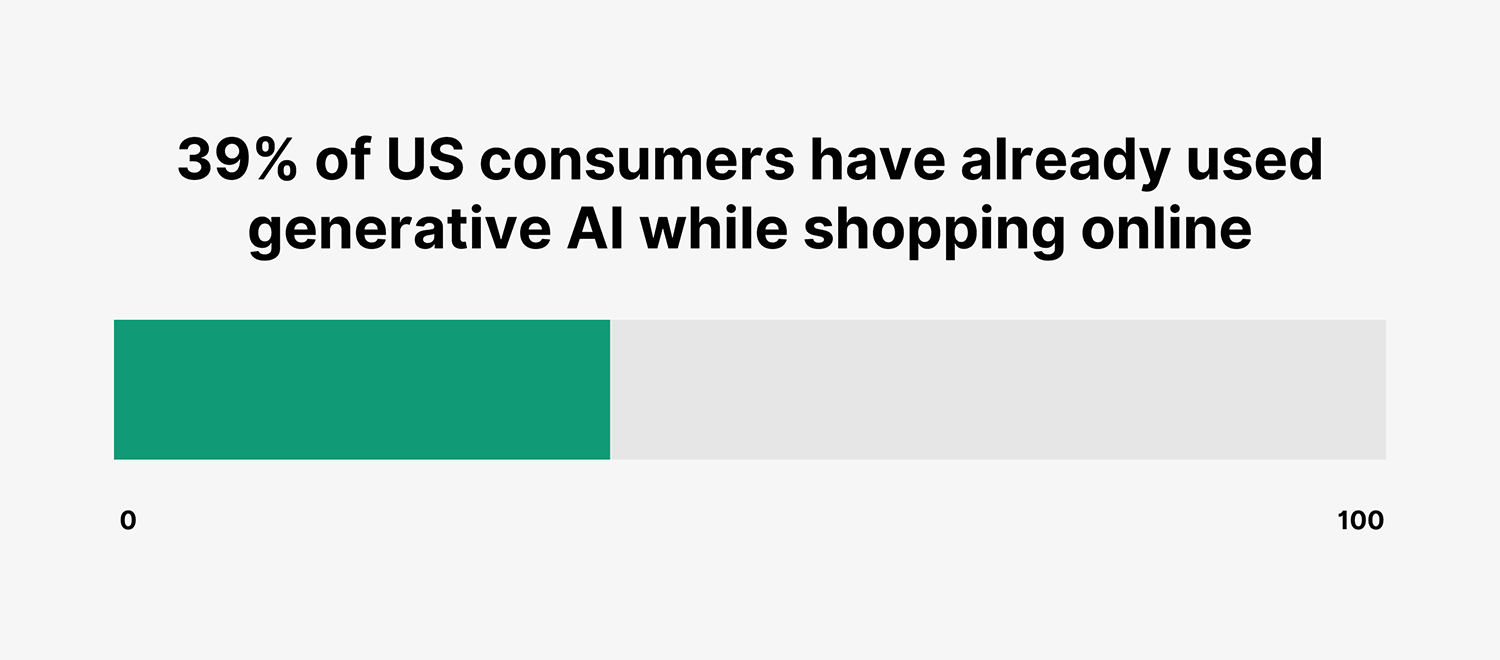
Common generative AI use cases for online shopping include product research (55%), product recommendations (47%), finding deals (43%), and gift suggestions (35%).
Mobile ecommerce statistics
With the increased usage of smartphones, more consumers are looking for mobile-first online shopping experiences. These stats help explain the mobile commerce landscape.
29.9% of internet users worldwide aged 16–64 buy something online each week via a mobile phone (DataReportal).

Revenue from mobile ecommerce sales worldwide reached $2.51 trillion in 2025, accounting for 59% of total ecommerce sales (Statista).
Here’s a table with mobile commerce revenue worldwide, including its share of total retail ecommerce since 2017:
| Year | Mobile Commerce Worldwide | Share of Total Retail Ecommerce |
|---|---|---|
| 2017 | $500 billion | 40% |
| 2018 | $660 billion | 43% |
| 2019 | $810 billion | 46% |
| 2020 | $1.1 trillion | 48% |
| 2021 | $1.4 trillion | 49% |
| 2022 | $1.48 trillion | 52% |
| 2023 | $1.71 trillion | 54% |
| 2024 | $2.07 trillion | 57% |
| 2025 | $2.51 trillion | 59% |
| 2026 | $2.74 trillion | 60% |
| 2027 | $3.02 trillion | 62% |
| 2028 | $3.35 trillion | 63% |
Mobile ecommerce accounts for nearly half (44.1%) of US online sales in 2024, representing $564.1 billion in order value. By 2027, mobile commerce is forecast to reach $856.4 billion in US sales, accounting for 49.79% of online sales (eMarketer).
Here’s a detailed breakdown of mobile ecommerce growth in the US since 2023:
| Year | Online Sales (Mobile Devices) | Online Sales (Desktop/Laptop) | Online Sales (Total, US) |
|---|---|---|---|
| 2023 | $491.1 billion | $645.8 billion | $1.137 trillion |
| 2024 | $564.1 billion | $692.2 billion | $1.256 trillion |
| 2025 | $648.0 billion | $744.0 billion | $1.392 trillion |
| 2026 | $744.7 billion | $800.3 billion | $1.545 trillion |
| 2027 | $856.4 billion | $863.3 billion | $1.720 trillion |
There are an estimated 161.6 million mobile wallet users in the US alone, accounting for 64.9% of US smartphone users (eMarketer).
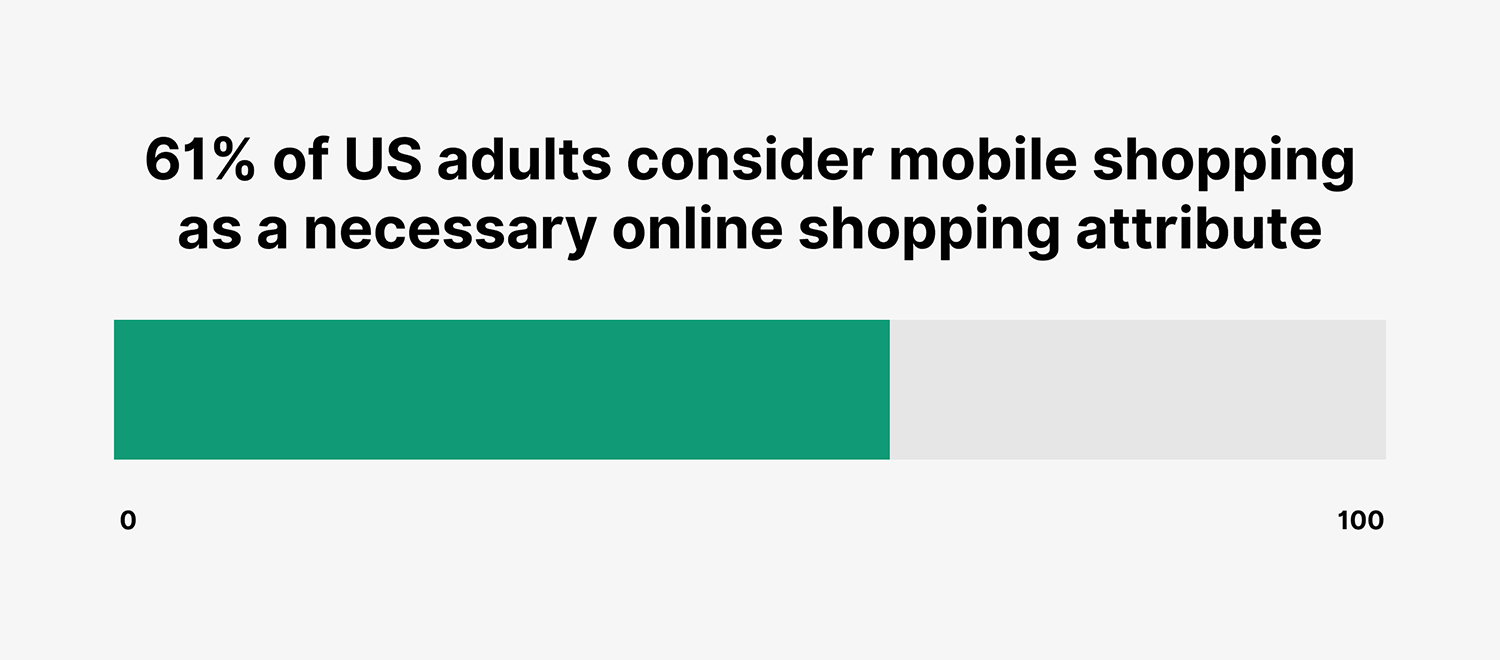
61% of American adults consider mobile shopping a necessary online shopping attribute (eMarketer).
The average conversion rate for online purchases made on mobile devices was 2%, compared with 3% on desktops (eMarketer).
In March 2025, traffic from mobile devices to ecommerce sites accounted for a 75% share (Dynamic Yield).
Social media ecommerce statistics
From brand and product discovery to direct purchases, social media has transformed the ecommerce industry. These statistics offer insights into social commerce.
50.6% of social media users in the US made at least one purchase via a social channel in 2025 (eMarketer).
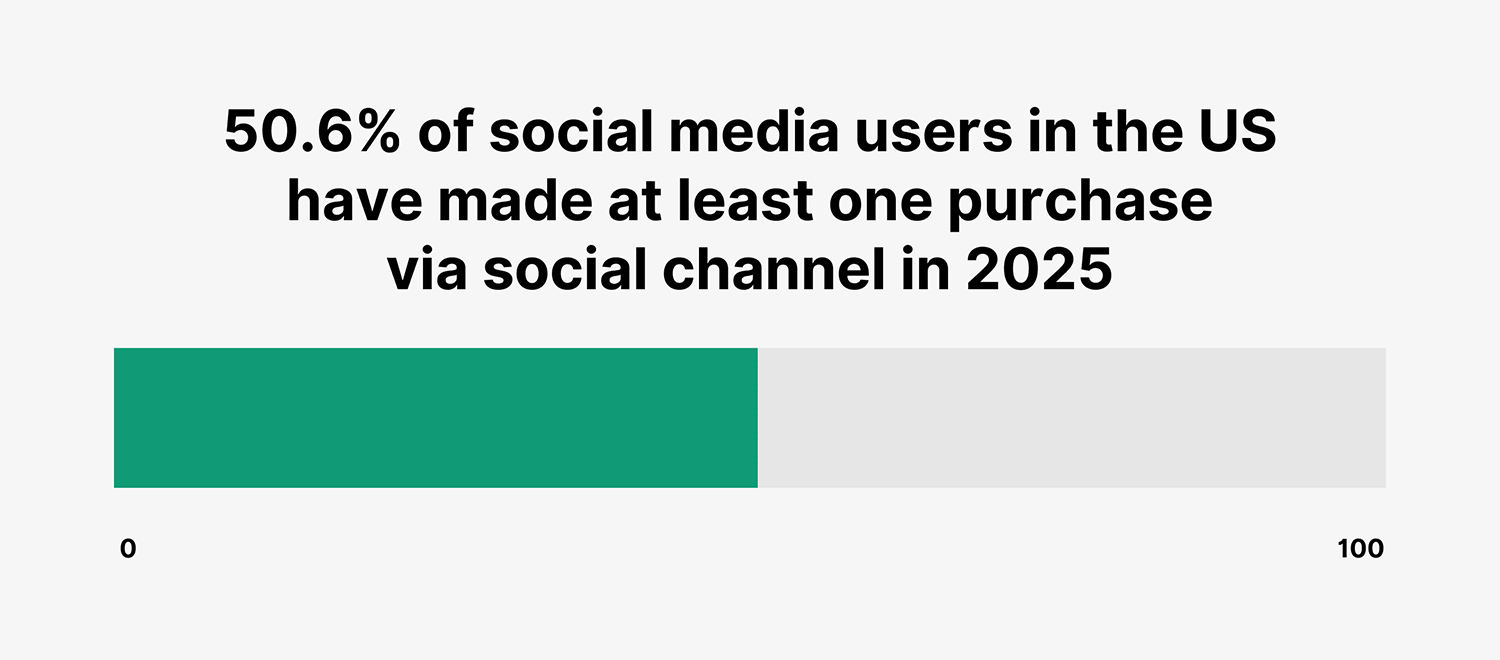
Here’s a detailed breakdown of US social buyers since 2021:
| Year | US Social Buyers | Share of Social Media Users |
|---|---|---|
| 2021 | 96.9 million | 46.6% |
| 2022 | 102.6 million | 48.4% |
| 2023 | 106.8 million | 49.5% |
| 2024 | 110.4 million | 50.3% |
| 2025 | 113.2 million | 50.6% |
| 2026 | 115.8 million | 50.7% |
| 2027 | 118.1 million | 50.9% |
US social commerce sales reached $67.06 billion in 2023, up from $26.97 billion in 2020. Sales are forecast to grow to $144.52 billion by 2027 (eMarketer).
Average social commerce spending per buyer in the US amounted to $627.80 in 2023, up from $337.70 in 2020. Spending per buyer is forecast to reach $1,223.70 by 2027 (eMarketer).
23.1% of social commerce users in the US are 25 to 34 years old (eMarketer).
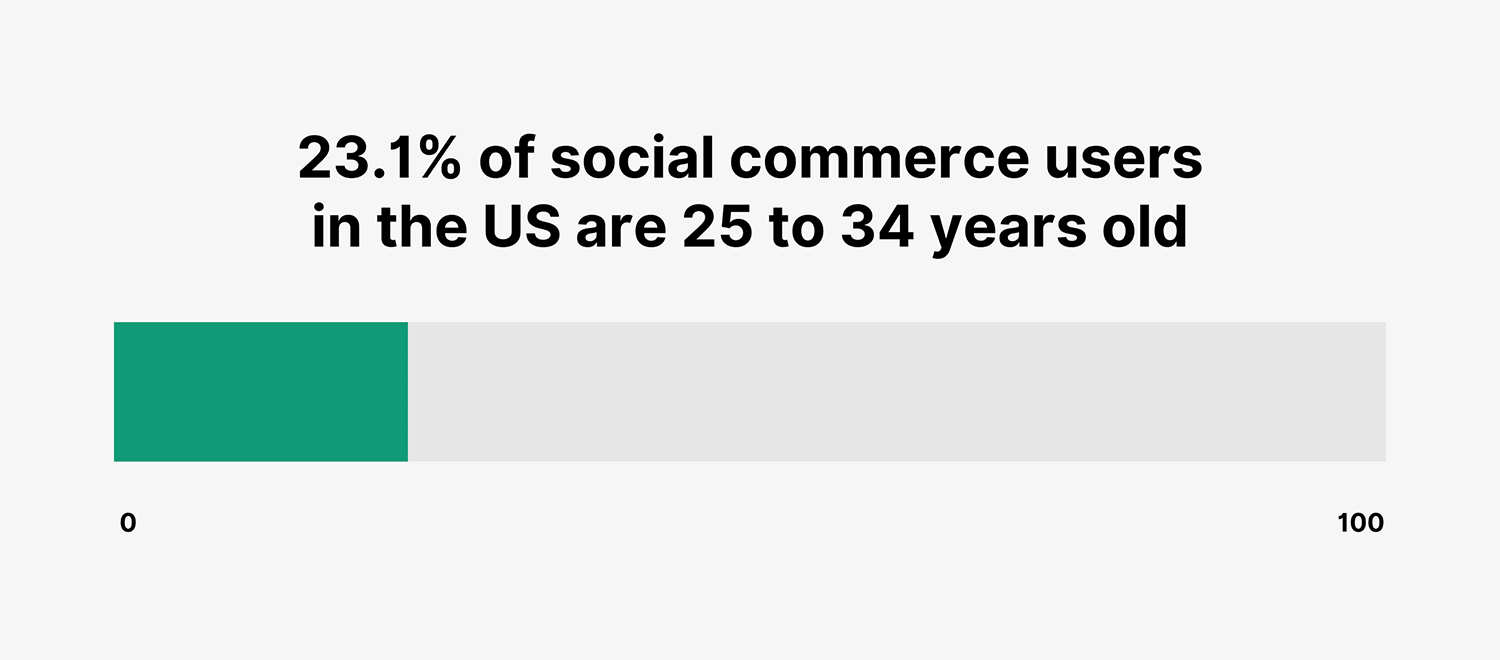
Here’s a detailed breakdown of US social buyers by age group:
| Age Group | Share of US Social Buyers |
|---|---|
| 14–17 | 7.5% |
| 18–24 | 16.8% |
| 25–34 | 23.1% |
| 35–44 | 19.1% |
| 45–54 | 13.5% |
| 55–64 | 10.4% |
| 65+ | 9.6% |
Facebook (49%), YouTube (46%), and Instagram (40%) are the social media platforms where American adults are most likely to make direct purchases (eMarketer).
Among Gen Z (ages 18–26) in the US, Instagram (71%), YouTube (68%), and TikTok (68%) are leading destinations for social commerce (eMarketer).
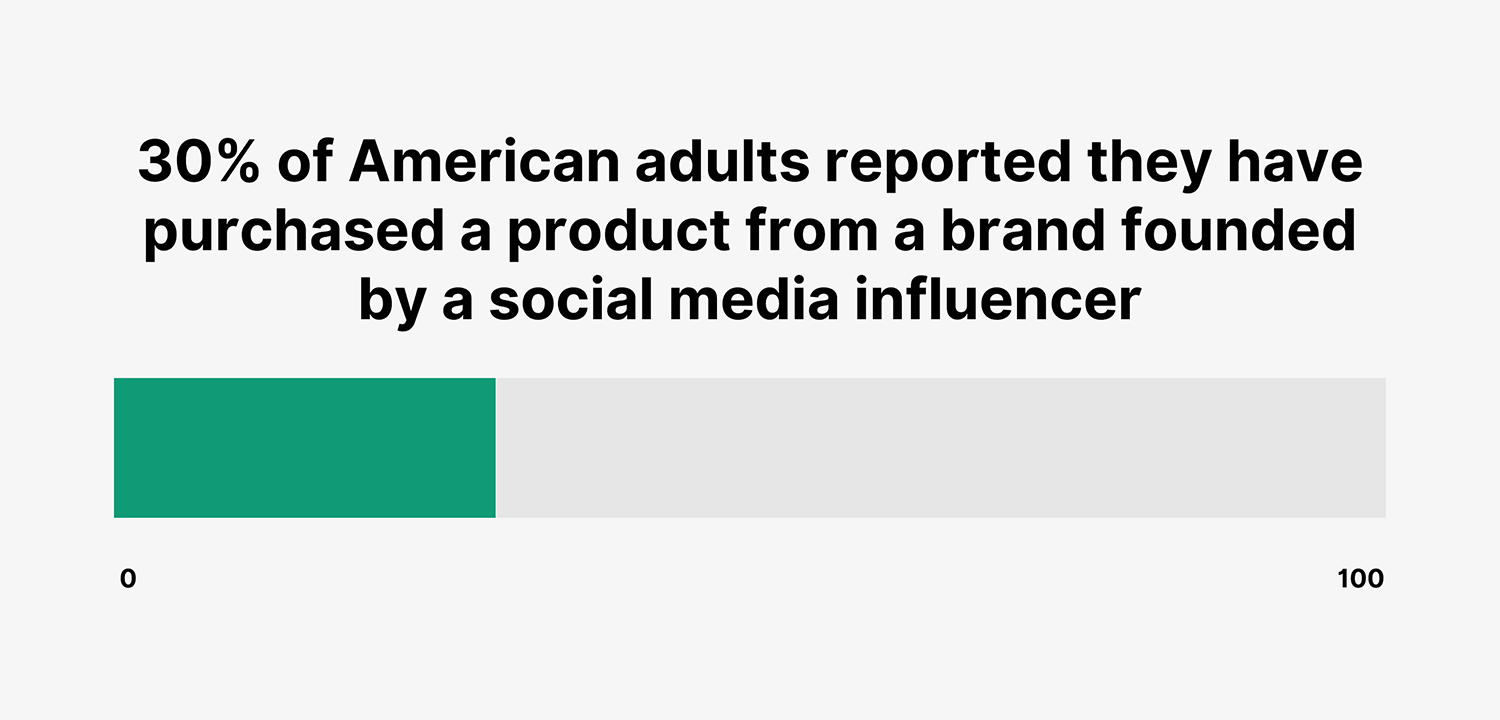
30% of American adults reported that they have purchased a product from a brand founded by a social media influencer. Among Gen Z and millennials, that figure is 53% and 47%, respectively (Morning Consult).
53% of consumers say they discover new products on social media (Salesforce).
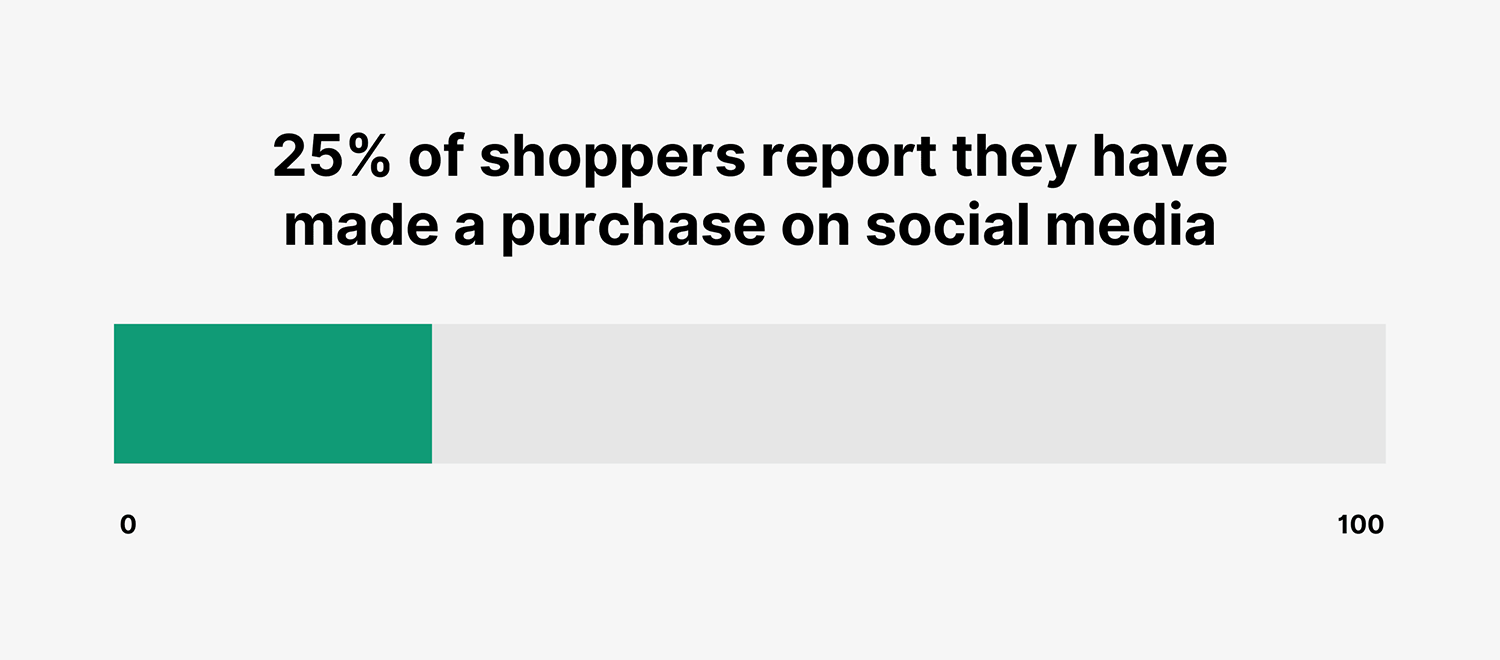
25% of shoppers report that they have made a purchase on social media (Salesforce).
The data points to where online retail is headed next
Ecommerce now accounts for over 20% of global retail sales, and that share keeps climbing. Mobile devices drive more than half of all online transactions worldwide, social commerce is converting browsers into buyers at scale, and generative AI is already influencing how consumers research and discover products.
For retailers and marketers, these numbers highlight where to focus: fast, frictionless checkout experiences, mobile first design, and visibility across the channels where shoppers actually start their journeys.
Dig into the details:
- Shopify revenue and merchant statistics: A comprehensive breakdown of Shopify’s merchant count, gross merchandise volume, revenue, and global market share.
- Top ecommerce trends for 2026: Four trends shaping online retail this year, from AI agents and unified commerce to TikTok Shop and livestream shopping.
- Ecommerce SEO: start where shoppers search: A complete guide to optimizing product and category pages for search, covering keyword research, site architecture, and technical SEO.
Explore more on
Editorial disclosure
Search Engine Land is owned by Semrush. We remain committed to providing high-quality coverage of marketing topics. Unless otherwise noted, this page’s content was written by either an employee or a paid contractor of Semrush Inc.
About the author