Using JavaScript to publish content? Here are 6 ways to view rendered HTML via desktop and mobile
Always test your pages using Google’s own tools and third-party resources to view the rendered HTML to make sure all your content is showing up.
Google has come a long way with rendering JavaScript. And with various JavaScript frameworks being used more and more to publish content, it’s critically important to make sure Google can accurately render all of the content on a page. If for some reason Google can’t accurately render your pages, then some of that content might not be indexed. And in a worst-case scenario, significant parts of your main content will not be indexed.
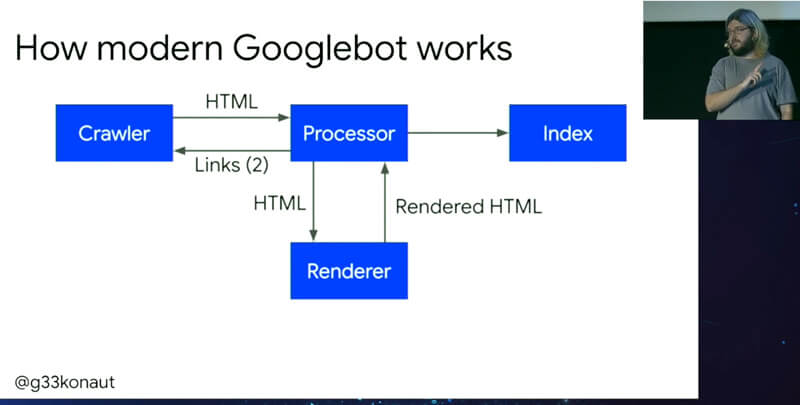
First, if you aren’t familiar with how Google renders JavaScript, then this video segment from Google’s Martin Splitt sums it up nicely (at 10:46 in the video). Google crawls the page and sends the page to the processor for rendering. The static HTML is indexed while links found are passed back to the crawler for discovery. The processor plugs the page into Chrome (version 41 as of now) and renders the content, including content published via JavaScript. Then the resulting page is indexed, while any additional links found are passed back to the crawler for discovery.
So, there’s a two-phase approach to indexing JavaScript-based content:
Beyond content discrepancies in the rendered HTML, you might find important directives are missing, or have moved to a new location in the code. I wrote a case study recently where the meta robots tag was moving one thousand lines down the code, and out of the head and into the body of the document. Scary, right?
For site owners and SEOs, that’s why it’s extremely important to test your pages to ensure all of your important content is being rendered properly. Unfortunately, while helping many companies over the past several years, I’ve noticed that a number of them didn’t know the best ways to view the rendered HTML. They simply looked at their pages in the current version of Chrome, maybe crawled their sites (without JavaScript rendering on) and thought all was good. Unfortunately, that leaves a lot of room for error. And again, in a worst-case scenario, a site can end up with a significant chunk of content not being rendered.
So testing is really, really important.
That’s why I decided to write this post. Below, I will cover six ways you can view the rendered HTML for your pages. The focus will be on Google’s own tools, but I will cover some third-party tools as well at the end.
1. URL inspection tool in GSC
Google Search Console (GSC) has provided the ability to render your pages for a long time using Googlebot desktop and Googlebot for Smartphones via the Fetch as Google tool (in the old GSC). That has worked well, but Google recently launched a powerful new tool that does even more – The URL Inspection Tool.
The URL inspection tool provides a wealth of information about URLs on your site, including if they are indexed, if there are any problems that would cause indexing issues, canonicalization information, the ability to view the rendered HTML and more.

As you probably caught in that last sentence, you can view the rendered HTML for the pages you test. If you click “view crawled page,” you will see three tabs to the right. Those tabs contain the HTML that Google has for the page so far during the indexing process.
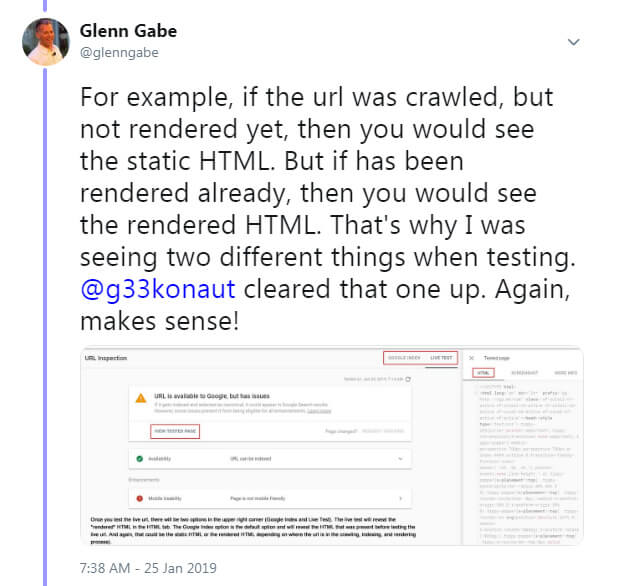
That’s important to understand since it can contain the static HTML, or the rendered HTML, depending on how long it’s taking to be fully processed. I noticed that pretty quickly when testing the tool and pinged both Google’s John Mueller and Martin Splitt about this. I also asked that question to them in person during the SEO meetup at Google’s headquarters in New York. Here’s my tweet about that:
The second tab contains a screenshot of the rendered page (only when testing live URLs via the “test live URL” button). In a perfect world, your render will look accurate and not be missing key pieces of content. But, we’re not in a perfect world. There are unfortunately times the screenshot will not accurately reflect your rendered page. That could be due to a rendering problem, or it could be because the inspection tool is timing out. That’s why it’s important to check the rendered HTML code to see if the content is present (and not just rely on the screenshot).

Regarding the tool timing out, Google’s John Mueller has explained that can be ok, since Google’s actual rendering system will often cache resources and have a longer timeout. So just keep that in mind when using the URL inspection tool. I know there’s a lot of confusion about that. Here’s a video of John Mueller explaining this (at 43:35 in the video):
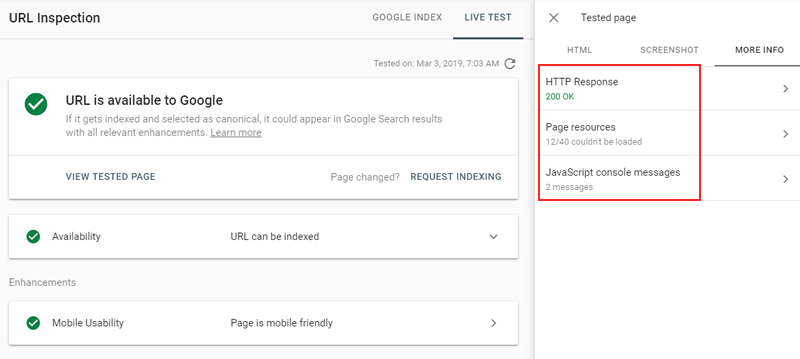
And the third tab contains helpful information about the URL, such as response codes, page resources that couldn’t be loaded, and then JavaScript console messages (where you can view errors and warnings).
Important notes about Googlebot user-agent: When the URL inspection tool first rolled out, you could view both the desktop render and mobile render from within the tool. For some reason, that changed soon after and the tool only enables you to view the rendered HTML via the user-agent that fits your current indexing status. For example, if you have been moved to mobile-first indexing, then you will only be able to view the rendered HTML and screenshots via Googlebot for Smartphones. And if you haven’t been moved to mobile-first indexing yet, then you will see the desktop renders.
The URL inspection tool initially showed both desktop and mobile renders:
I have specifically asked for the dual-render functionality back in the URL inspection tool and John Mueller has said he would ping the GSC product team about that. But there’s no guarantee that’s coming back. I’m hopeful, though.
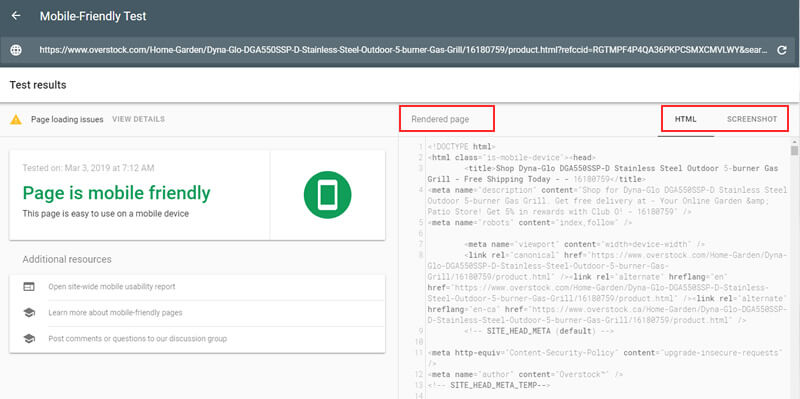
2. Mobile-friendly test (MFT)
The next method of viewing the rendered HTML for a page is via Google’s mobile-friendly test. The tool will render the page using Googlebot for Smartphones, show you a screenshot of the rendered page, and provide the rendered HTML code of the page.
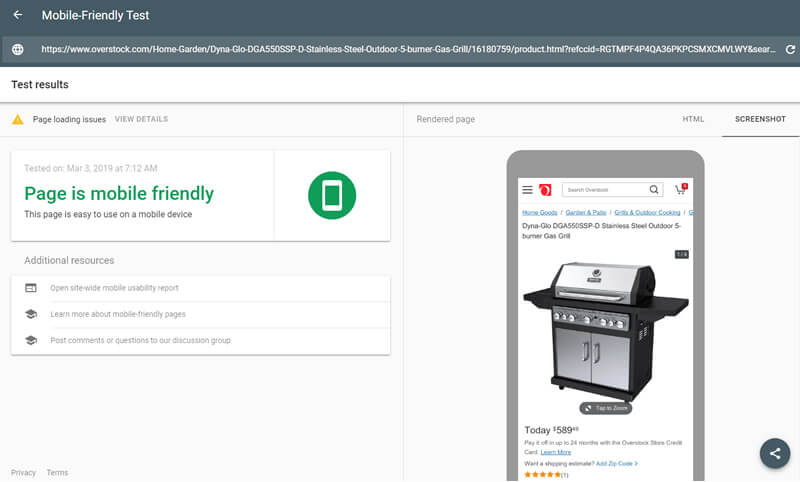
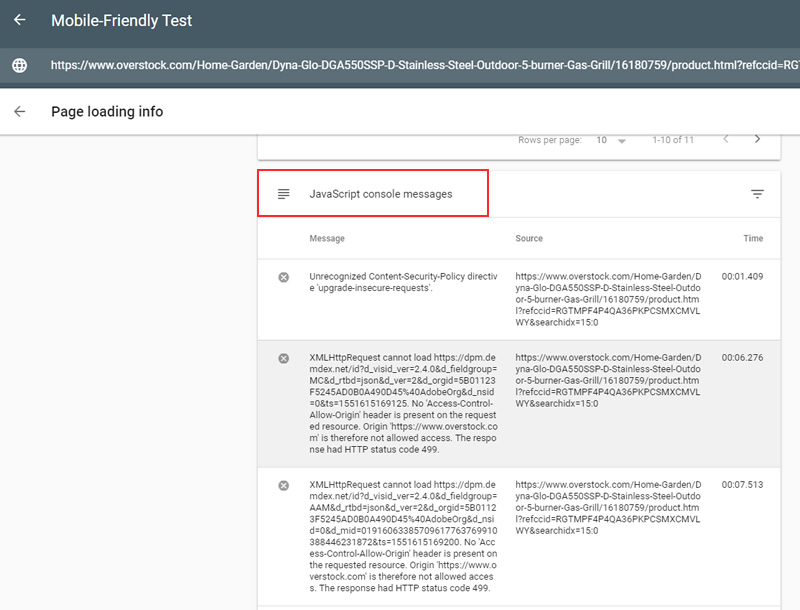
In addition, you can view page resources that didn’t load properly and a JavaScript console with warnings and errors (just like the URL inspection tool).

Note: If you really want to dig into the rendered code, then you should copy and paste the HTML from the mobile-friendly test into a third-party text editor. Working with the code in the tool itself is a bit clunky.
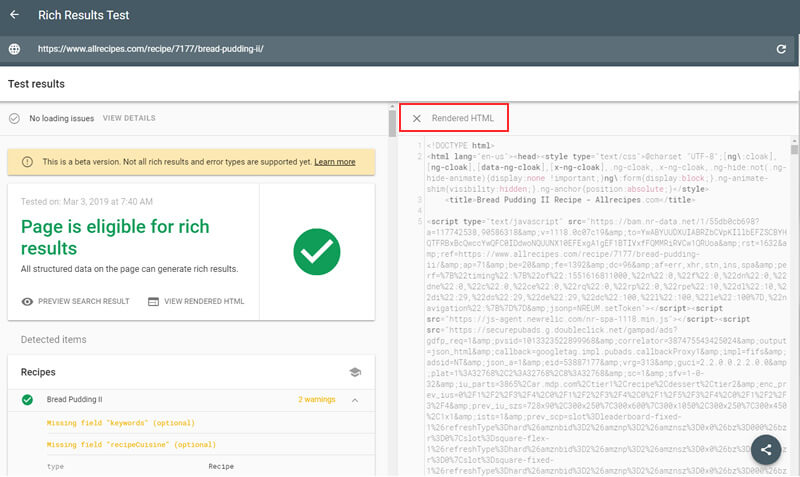
3. Rich Results Test
Based on the first two methods I have covered so far, you should have noticed a common theme. The renders were mainly focused on mobile and not desktop. Sure, we live in a mobile world right now, and that should be the focus, but you should still double-check the desktop renders as well! Again, the URL inspection tool will only show the desktop render and screenshot for sites that haven’t been moved to mobile-first indexing yet.
So, what’s a site owner to do??
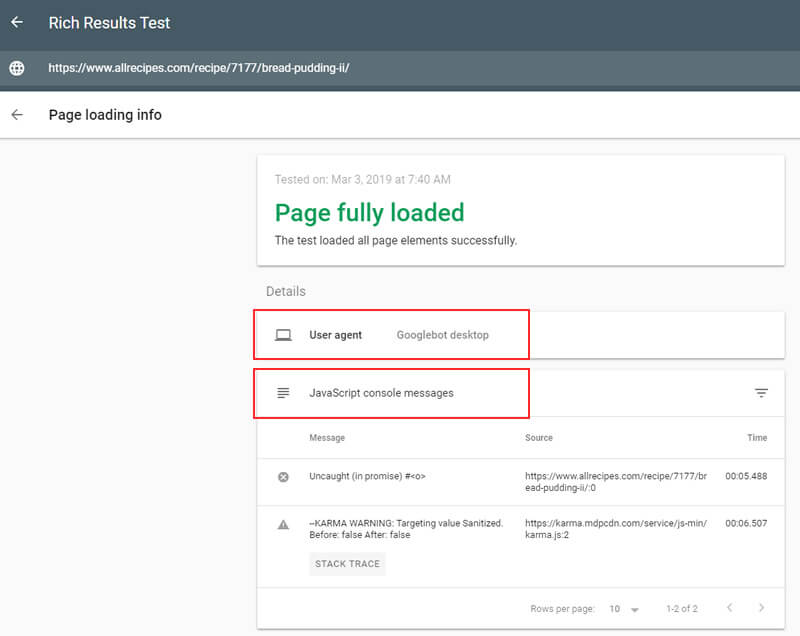
Well, Google has you covered, but just not in the place(s) you thought it would be. Many don’t know this but you can use the Rich Results Test to view the rendered HTML based on Googlebot desktop! Googlers have mentioned this before, but I find many still don’t know about it.
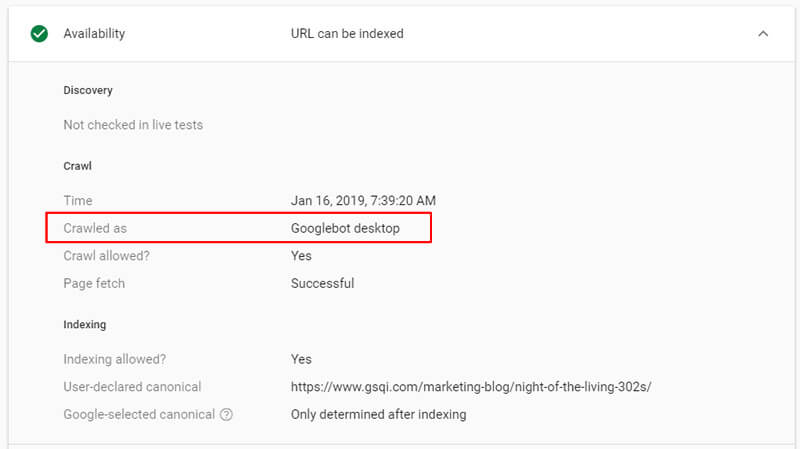
Once you test a URL, you can view the rendered HTML, page loading issues and a JavaScript console containing warnings and errors. And remember, this is the desktop render, not mobile. The tool will show you the user-agent used for rendering was Googlebot desktop.
Bonus Methods: Chrome, crawlers, and plugins: When you want to view the rendered HTML for a page, I would start with Google’s tools (as I covered above). But that doesn’t mean they are the only ways to check rendered pages. Between Chrome, third-party crawling tools, and some plugins, you have several more rendering weapons in your SEO arsenal.
I won’t go into too much detail here (this post is long already), but I did want to mention them at least.
4. Crawlers – Rendering in bulk
The methods I covered above are great for checking specific URLs, but what happens when you want to check rendering in bulk? For example, maybe you’re crawling a site with 10K, 50K, or 500K pages and want to check the rendered versus static HTML.
Well, that’s where crawling tools come in very handy. I’ve covered my favorite crawling tools here before, and it’s important to note that each of the tools provides the ability to render JavaScript during the crawl. For example, DeepCrawl (where I’m on the customer advisory board), Screaming Frog, and Sitebulb all offer JavaScript rendering capabilities.
When setting up a crawl in DeepCrawl, make sure to check “Enable JavaScript-rendering:”

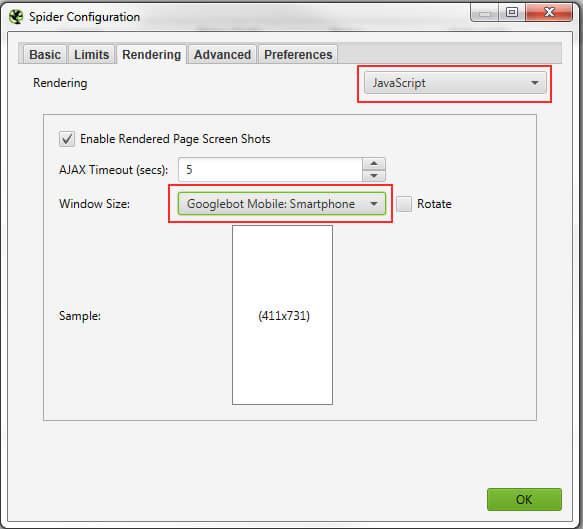
For Screaming Frog, use the dropdown within the rendering tab in the Spider Configuration options:
In addition, Screaming Frog enables you to view the rendered screenshot for each page you crawl and compare the rendered HTML vs. the static HTML:

And Sitebulb provides the same type of functionality (JavaScript crawling with the ability to compare rendered versus static HTML and view screenshots. Sitebulb also highlights the differences):


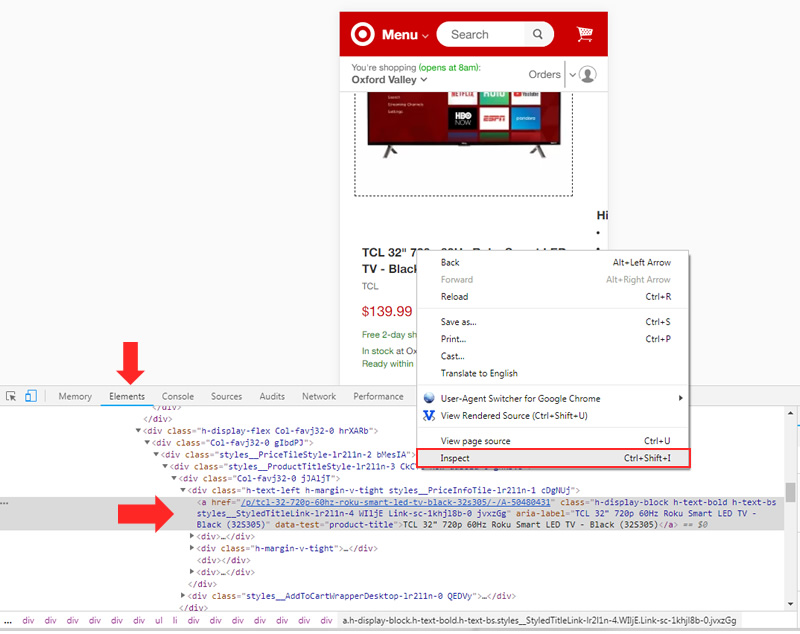
5. Chrome Dev Tools – Inspect elements
Sometimes you just want a quick view of the rendered HTML while checking a page. That’s without having to launch a tool or crawl a site. When you use Chrome Dev Tools (which packs a lot of power right within Chrome), you can easily inspect the page and view the rendered HTML. It’s a quick way to view the rendered code.
6. Chrome plugin – View rendered source
Last, but not least, is a nifty Chrome plugin from Jon Hogg called View Rendered Source that enables you to view both the static HTML and rendered HTML side-by-side. Not only does it show you the static and rendered code, but it will highlight the differences! So, if something doesn’t look right, and you want to double check the differences, then this plugin should absolutely help you out. I use it often.

Render complete – Some closing notes and tips
Here are some closing tips to make sure you cover your bases from a rendering standpoint:
- Make sure to review the rendered HTML to ensure your main content is accurately present in the code. Don’t be in a situation where the page looks great in the current version of Chrome, but Google can’t find important pieces of content after rendering. And check both the mobile and desktop renders.
- Check important directives delivered via the meta robots tag. I explained a case study I wrote where the meta robots tag using noindex was being moved one thousand lines down the code. Make sure weird things like that aren’t happening with your directives. That could have a massive impact on your site from an SEO standpoint.
- Make sure rel canonical is set correctly in the rendered HTML. Heck, make sure it’s still there in the code! Again, I’ve seen some crazy things happen to pieces of code in the rendered HTML. And you don’t want to botch the canonical URL tag, that’s for sure.
- Check structured data to make sure the rendered code is accurate, contains all of the necessary markup, etc. Structured data is one of those items that can easily be overlooked.
- Check your navigation and internal linking to make sure you aren’t dropping links in the rendered HTML. Internal links are extremely important as they provide a way for Google (and humans) to find additional content on your site. They also provide context for Google about what it’s going to find on the other end of a link.
- If you’re targeting different languages and countries, make sure you check hreflang tags in the rendered HTML. I’ve seen hreflang tags either going missing or break in the rendered HTML. And make sure the entire hreflang cluster is provided on each page that’s included in the cluster.
- Make sure you review images in the rendered HTML, especially if image search is important to you. Double check the image code, alt text, title attributes and captions if you’re using them. Don’t simply check your page in the latest version of Chrome and think all is ok. Definitely review the rendered HTML across both mobile and desktop.
Summary – There’s more than one way to render a page
After reading this post, I hope you’re ready to render your pages across a number of tools. As I explained above, it’s critically important to test your pages to make sure your content is showing up in the rendered HTML. And then there are other elements invisible to the naked eye that need to be checked as well. For example, the meta robots tag, rel canonical, structured data, hreflang tags, and more. By using Google’s own tools, and the third-party tools I mentioned at the end of this post, you can cover your bases from a JavaScript rendering perspective. And that can only help your organic search efforts. So render away!
Contributing authors are invited to create content for Search Engine Land and are chosen for their expertise and contribution to the search community. Our contributors work under the oversight of the editorial staff and contributions are checked for quality and relevance to our readers. Search Engine Land is owned by Semrush. Contributor was not asked to make any direct or indirect mentions of Semrush. The opinions they express are their own.


