How To Use Regression Analysis To Estimate Incremental Revenue Opportunities
My previous article was about estimating the potential for growth for those paid search campaigns capped due to insufficient budget. This was definitely the easy part since the logic behind the assumptions involved in the calculation was fairly simple. Now, we can address those paid search campaigns capped due to insufficient rank – and there […]
My previous article was about estimating the potential for growth for those paid search campaigns capped due to insufficient budget. This was definitely the easy part since the logic behind the assumptions involved in the calculation was fairly simple.
Now, we can address those paid search campaigns capped due to insufficient rank – and there are going to be more assumptions involved since all metrics are going to be impacted: the rank obviously, then the CTR, CPC, and pretty much everything else as a result.
This article goes beyond impression share (IS) analysis and is actually mostly about regression analysis. Given the number of assumptions involved, the numbers we’ll come up will be closer to directional estimates rather than actual predictions; although in some cases, this methodology turns out to be very accurate.
How To Mitigate Lost IS (Rank)?
The Lost IS (rank) metric is an interesting, however, vague metric – officially it is “the percentage of time that your ads weren’t shown due to poor Ad Rank.” Hence, a couple of initial comments:
• A “poor” Ad Rank is usually due to two main factors: a low Quality Score or a low bid. AdWords does not provide the details, while Bing Ads does, thanks to a couple of additional useful metrics: “Impression share lost to bid,” and “Impression share lost to keyword relevance.”
• A “poor” Ad Rank actually means your average rank is not 1.0 across the board. That’s where it gets tricky since rank 1.0 is just not achievable across the board, especially for phrase and broad generic terms, even with insanely high Quality Scores and bids since Google keeps testing and rotating different ad copies all the time and tends to reward advertisers using exact match type.
• If rank 1.0 was achievable in phrase and broad match types, the traffic quality (understand conversion rate) would most likely decrease because of even broader queries being associated with your keyword list when bidding is up.
The bottom line is that advertisers who want to scale up their PPC program should first focus on ad relevancy, then aggressive bid management, while keeping in mind that rank 1.0 is just not achievable in most cases. For the sake of this article, I’ll focus on the impact of a more aggressive bidding strategy – i.e., I’ll keep relevancy optimizations aside.
Estimating Incremental Available Impressions
Similar to the way one can estimate overall available impressions based off Impression Share (IS) data, one can estimate missed impressions due to rank based off Lost IS rank data. More specifically: Missed Impressions(rank)=Impressions*Lost IS(rank)/IS, hence the below sample table.
Those are all missed impressions because you were not in rank 1.0, which in not achievable, anyway, but at least, we’ve got some hard limits that we can use for reference.
Analyzing The Relationship Between Rank, Impressions, CTR & CPC
From my experience, the best way to go about it is to first explore multiple scenarios so you get a good understanding of the relationship between rank, impressions, CTR, CPC, ad spend and revenue.
You basically want to collect enough data to measure the elasticity between those metrics and answer the following question: seasonality aside, what would happen if I spent $X more? This is precisely where a regression analysis can help figure this out.
Also, just looking at the relationship between ad spend and revenue is usually not insightful enough to actually draw any sort of actionable conclusions. In other words, you need to first understand the relationships between rank, impressions, CTR and CPC, then determine the ad spend vs. revenue numbers.
Then, comes the question of which data model to use: linear, logarithmic, exponential, polynomial, etc. A fairly simple way to go about this in Excel is to:
• Add a trend line to your scatter chart
• Try multiple regression types
• Consider the model with the greatest R-squared (determination coefficient) since the model with the greatest R-squared is the most reliable one.
Below is an example of what it looks like in Excel – similar scatter charts should be put together for the relationships between rank vs. impressions, and rank vs. CPC:
A “good enough” R-squared is usually greater than .85; however, in all reality there might be a lot of statistical noise, and you’ll most likely see much lower R-squared values. This can definitely be a major limitation when the data does not look good and your determination coefficients are low. Other than that, from my experience, the most relevant regression type is usually the exponential model.
Now, you should be able to establish the relationship between rank, impressions, CPC, and CTR such as:
• Impressions=a*Exp(b*Rank)
• CPC=c*Exp(d*Rank)
• CTR=e*Exp(f*Rank)
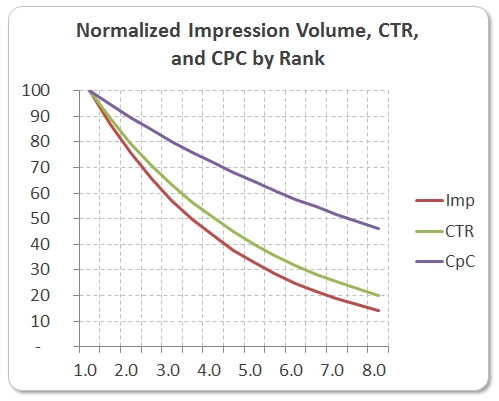
…where a, b, c, d, e, and f can be determined using Excel formulas based off your historical data. Then, you can simulate different scenarios by giving different values to the rank variable, from better ranks to worse values, and come up with the below chart.
Putting The IS & Regression Analysis Together
Getting back to our campaign level data, we can now leverage those regression models and apply them to each individual campaign (or ad group, if you’re looking at ad group level IS). Basically, it all depends on the current rank for each campaign or ad group.
Say your current rank is 3.29 and you found that the relationships between rank, impressions, CTR, CPC were as follows:
• Impressions = 812,454 * Exp( -0.15 * Rank)
• CTR = 0.04 * Exp ( -0.44 * Rank)
• CPC = 4.20 * Exp (-0.20 * Rank)
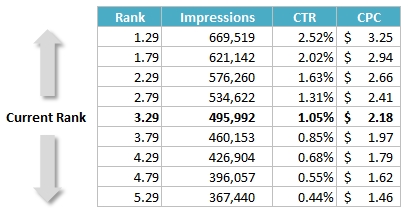
Then, we can establish the estimated impressions, CTR, CPC at multiple ranks:
Then, just make sure the greatest estimated number of impressions is lower than the total number of available impressions calculated earlier, otherwise, it means your data model is a bit “optimistic” and you need to consider another data model or perhaps dig into the data and exclude a couple of weeks of data with seasonal peaks or so.
Once this is done, you can determine all other metrics, append your conversion rate and average order value (AOV) numbers and come up with your final ad spend vs. revenue numbers, such as:
Note that I am assuming that both the conversion rate and AOV do not vary much with position, which makes sense to me for exact keywords, but not so much for phrase or broad keywords for which the associated search queries tend to be even broader when increasing the bids hence a dip in traffic quality.
Conclusion
This methodology presents several assumptions or defects, such as:
• Lost IS rank = 0% is only achievable when rank = 1.0 which is simply unachievable most of the time, except for exact branded keywords.
• “To combat Lost IS rank you have to bid up,” which does not address missed impressions due to poor Quality Score.
• “The relationships between rank, impressions, CPC, CTR are stable over time,” which is not true because of changes in the competitive landscape.
• Most of the times, you’ll get low R-squared values when producing data models in paid search due to a lot a statistical noise.
• “Conversion rate and AOV do not vary much with position,” which is mostly true in exact match type, but mostly untrue for phrase and broad keywords.
However, a best practice to mitigate all those assumptions and defects is to only apply this methodology to a subset of keywords in your program:
• Non-branded keywords not already in rank 1.0-2.0, since branded keywords typically do not have a lot of potential.
• Relevant keywords, i.e., those already optimized from an editorial standpoint with an ok Quality Score.
• Converting or assisting keywords. That’s where the opportunity lies anyway, so you can filter out those keywords which never assist nor convert.
In this particular case, search marketers can actually come up with actionable insights in terms of what keywords to jack up the bids on, and what a good target rank and CPC is for those guys to generate incremental and profitable growth.
Contributing authors are invited to create content for Search Engine Land and are chosen for their expertise and contribution to the search community. Our contributors work under the oversight of the editorial staff and contributions are checked for quality and relevance to our readers. The opinions they express are their own.
Related stories


