adCenter’s Transparent Quality Scores – Will Google Respond?
There’s an old adage that goes “It’s not just what you say, it’s how you say it that counts.” Having been married for 31 years next month, I can attest to the simple, powerful truth of that statement. I feel the same way about the differences between Google and Microsoft’s approaches to quality score. For […]
There’s an old adage that goes “It’s not just what you say, it’s how you say it that counts.” Having been married for 31 years next month, I can attest to the simple, powerful truth of that statement.
I feel the same way about the differences between Google and Microsoft’s approaches to quality score.
For the most part, what Google and Microsoft are saying to us through their quality scores, is that they want us to understand how important selecting highly relevant keywords, creating relevant ads and sending searchers to relevant landing pages is to a successful paid search campaign.
How Google and Microsoft communicate with us, through their quality score implementations, is remarkably different. That’s what I would like to talk about in this month’s column.
News Flash: Microsoft Now Reporting Quality Scores
Any minor news or update concerning AdWords quality score seems to make major headlines, and yet when Microsoft rolled out its own brand-spanking new quality scoring system, it barely made a ripple in the SEM trade news.
Granted, it’s hard to be heard above the quality score chatter in the AdWords’ world. Over the years, there have been literally thousands of articles, blogs, tweets and conference presentations devoted to it.
There’s even an entire book dedicated to the topic, released just this month by my fellow SEL contributor and paid search expert, Craig Danuloff. Craig’s book is called “Quality Score in High Resolution.” I strongly recommend that you stop what you are doing right now, go order yourself a copy of Craig’s book and then come back here to finish this article.
On the other hand, there has been relatively little written about on adCenter Quality Score, other than Joseph Kershbaum‘s pre-release preview of adCenter quality score in April over at SEW, “Inside the adCenter Quality or Should We Call it Competitive Score?” and his presentation at the SMX Advanced conference earlier this month in Seattle.
I wonder how many SEM professionals glossed over Microsoft’s adCenter quality score announcement and brushed it aside as just another attempt by Microsoft to play catch-up with Google.
That would be an unfortunate oversight, because we are finding that the insights we’ve been able to glean from Microsoft’s new quality score reporting is leading to paid search performance breakthroughs on Google as well as on Yahoo and Bing.
How AdCenter Quality Scores Work
Microsoft uses quality scoring for many of the same reasons Google does, but Microsoft implements it in a much different way.
Perhaps the most intriguing aspect of adCenter quality score is that it exerts no influence at all on how ads rank or what advertisers pay for clicks. The reporting is there simply to provide advertisers with important data to help optimize their adCenter performance.
That stands in sharp contrast to Adwords, where quality score has a direct and immediate impact on ad rank (ad rank = quality score * max. bid) and advertising costs.
That leads to a second, very refreshing aspect of adCenter quality scores: greater transparency. Microsoft has expressed their interest in driving greater transparency into how its ad ranking systems work by providing quality scores for every keyword and match type in your account and how those scores change over time.
I have found that the adCenter reporting helps identify optimization targets more quickly and easily and as well, to measure how changes you are making are impacting your quality scores over time.
Again, that contrasts sharply with the opaque nature of AdWords quality scores reporting. There is no easy way within AdWords to track changes in quality score over time and no way at all to break out your keywords by match type.
Microsoft adCenter reports an overall keyword quality score (1-10) based on three sub-scores – Keyword Relevance, Landing Page Relevance and Landing Page User Experience.
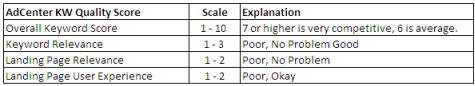
adCenter Quality Score and it's 3 Component Sub-scores
It’s Not Just What You Say, It’s How You Say It
It’s funny how a simple change to reporting can change your whole perspective on optimization challenges and your approach to developing solutions.
For years, we’ve been managing to AdWords quality score, and except for the non-specific litany of “delete keywords, make smaller ad groups, write better ads, and improve landing pages,” it has never been easy to obtain actionable insights from quality score data.
Our standard plan of attack had been to add tons of new negative keywords and tighten up match types, with the idea that improving CTRs would improve our quality scores. We’ve since come to discover, that while these are always good things to do in your accounts, after you read Craig Danuloff’s book, you will realize that adding negatives and changing match types absolutely no impact on your Adwords quality scores.
The data we are collecting now from adCenter quality score reports is providing us with deeper and more actionable insights into our campaigns right down to the keyword level.
In addition to the normal CTR, CPA, CVR and CPC data we use to identify areas ripe for optimization, we now have the four additional quality score signals from adCenter that help inform our action plans.
With the adCenter quality score data, we are able to identify positive and negative trends and patterns in our data that allow us to dig in more quickly and deeply. Any optimization ideas we generate, by the way, are usually just as applicable to Google campaigns as to our Yahoo and Bing campaigns.
For example, here is a slice of a report we imported into Excel for one of our accounts:
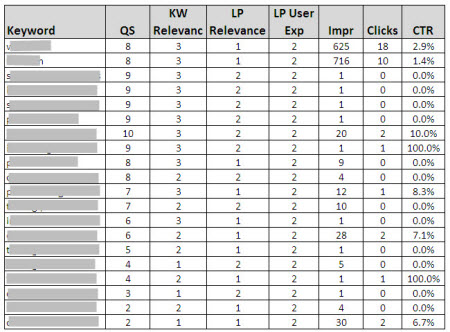
Microsoft adCenter Quality Score Data
Even without seeing the keywords, we can start to see patterns in the data – even without constructing trendlines.
The first column, QS, is the overall quality score of the keyword and indicates the overall competitiveness of this keyword in the market. The overall Quality Score is made up of the three sub-scores, Keyword Relevance, Landing page relevance, and Landing Page User Experience.
Looking at the QS Column, we can see that keywords in the first two rows have very good overall quality scores (8) and the rest vary all over the place. The overall QS is reported on a scale of 1-10, where anything above 7 is fine. Keywords scoring 6 or below are probably being filtered out of the auction. Those are the words we need to either optimize or take offline.
Looking again at the top two rows, we can see that for our two QS8 keywords, the Landing Page Relevance Scores (1) in column 3 are poor. This suggests that while the keyword is doing well in the auction, the landing page may be limiting performance and we ought to take a closer look at the conversion rates for those pages.
Optimization suggestions may include finding a better, more relevant landing page on our site, or creating a new landing page altogether. In this particular case, the solution was even easier than that. We discovered that the landing page did not contain our keyword at all – though it did contain a commonly used synonym that most people understand to be equivalent. The optimization solution was to add the keyword into the page copy, Title and Description tags.
The Keyword Relevance Score in Column 2 shows how this keyword fares against other keywords in the auction, primarily based on its click-through rate (CTR). Broad match keywords will naturally have lower quality scores than phrase or exact match, because they compete against more keywords in any auction.
As we can see in the chart above, the KW Relevance scores range from 1 to 3. We generally don’t worry about KW Relevance scores of 2 or 3, but always take a hard look at keywords with QS1. In all KW Relevance optimizations, adding negative keywords and improving the click-through rates with better ads will improve those scores.
The third column shows Landing Page User Experience Score. Landing Page Experience is graded at either poor (1) or no problem (2) Since this keyword has score of 2, it is not a problem, it and we don’t have to do anything. If we did have an issue there, we’d review that page against the adCenter editorial guidelines.
Another great feature within adCenter quality score reporting is that you can get an immediate read on how your changes impact your quality score. While the final objective is to improve campaign performance, not just raise quality scores, it is nice to have this instant quality score feedback so you can move on to other optimization challenges in your account.
You can also run historical quality reports at any level within your account, using the filters within adCenter’s reporting interface. The example below shows the QS performance of a single keyword during June.
Interestingly, no changes had been made to this keyword during this period and yet the quality score fluctuates throughout the month. This is because adCenter measures QS relative to other competitors in the market, and if you haven’t made any changes, then you can infer your competitors are getting making changes.
The chart below indicates higher quality scores on Sundays, meaning you have less competition on Sundays. This sort of data, combined with your average position and bid data, may lead you to employ a different bid strategy on weekends:
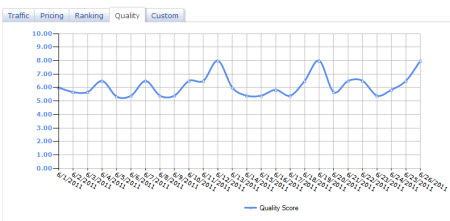
Microsoft adCenter Keyword Quality Score - Historical Trend
Conclusion
I’ve never been a big fan of obsessing about quality score, but now that both Google and Microsoft offer different types of quality score metrics, we all now have more data to draw insights from that can help us compete more aggressively in the marketplace.
With any luck, Microsoft’s foray into quality score will stimulate Google into responding by making its own quality scores more transparent and expose more of the ranking factors that we need to know about to do our jobs more effectively.
One thing I would like both vendors to consider adding is a direct quality score by keyword and ad combination, instead of averaging scores across all ads under test in an ad group.
Contributing authors are invited to create content for Search Engine Land and are chosen for their expertise and contribution to the search community. Our contributors work under the oversight of the editorial staff and contributions are checked for quality and relevance to our readers. The opinions they express are their own.
Related stories
About the author