Use Google’s Search Console API & Pivot Tables To Supercharge Your Long-Tail SEO
Columnist Chris Liversidge explains how you can use the Search Analytics API to glean insights from your search query data in Google Search Console.

Google’s recent changes to their Search Console API have allowed for interesting data analysis via Impressions and Clicks data. Leveraging the power of Excel and Pivot Tables, an unprecedented level of detail is available to fine-tune your search marketing campaign.
Querying The Queries
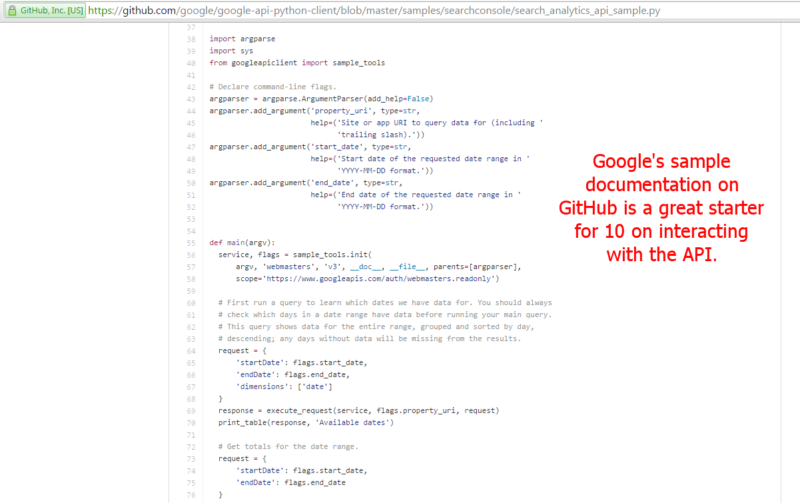
Google’s API documentation has excellent code samples and query structure guidance, and it should be considered essential reading for any SEO looking to push data to the fore in their SEO strategies.
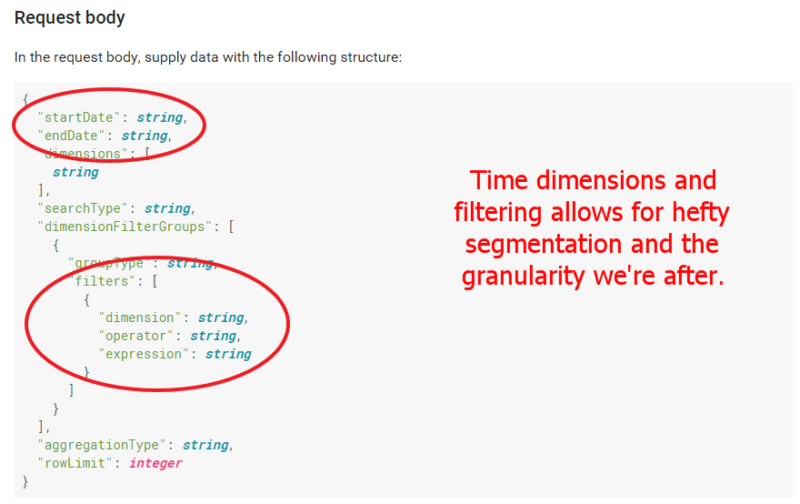
For today’s article, I’m going to cover the “Search Analytics: query” section, which explains how to use the Search Console API to query your search traffic.
The API allows segmentation of your data that mimics much of the functionality in the web interface.

So, why not just perform analysis in the web interface? Because by extracting the data, we can further filter it to gain real granular insight. In doing this through the API, we can automate repeating that analysis. If we are very clever, we can start data warehousing and build historic data comparison elements to our analysis.
Let’s walk through an example.
Grab all “web” data available in the Search Console historically, using a simple API call following the documentation in the link above: that’s 90 days of data, typically starting three days after the current date with Clicks, Impressions, CTR and Position.
Then, let’s amend our call to apply a filter against the API query string to remove any terms that feature our business’s brand name. This is our starting data, which we’ll call the “Generic Total Keyphrase Set.”
If you need a further steer on the code at this stage, try using one of the sample code starters provided by Google, like this Python code.
We’ll get 5,000 rows of data if we have enough search terms to fill it out. By adding more filters and concatenating your results with a dedupe function, you can expand that 5,000-row limit — and I’ve found it to be possible to get all generic keyphrase terms via this method for clients with very large search volumes and visibility.
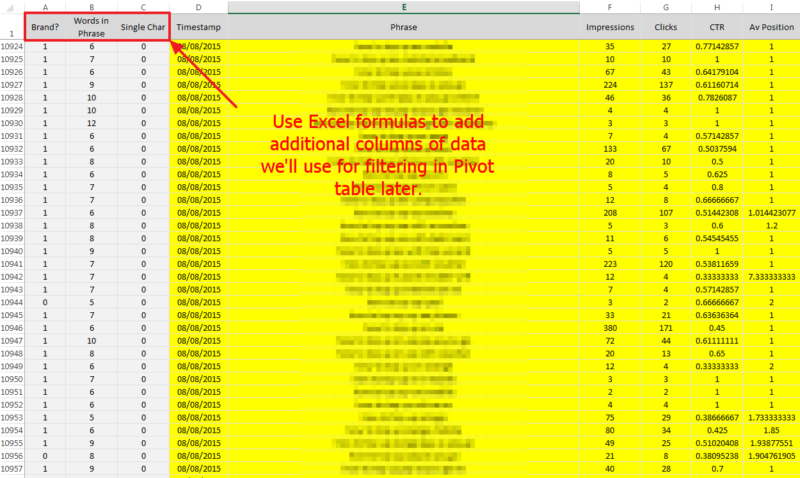
In my sample set, I have 52,500 rows of data to work from, which I paste into Excel. First up, I notice that despite filtering to exclude brand terms, I still have a few brand variations hidden in there, including data like the main published customer service phone line for the business (which has very high volumes).
So, to exclude this kind of data, I recommend creating cells into which you add brand variations (in my case, they are in cells M2 to M24), and use a formula like this to search the cell string for matches and return a value of “1” if there is a match to any of the cells. My spreadsheet has keyphrase data in column E. I’ve removed repetitions and replaced with an ellipsis below, but you can see the repetition required easily:
=IF(IFERROR(SEARCH($M$2,E2),0)+IFERROR(SEARCH($M$3,E2),0)+IFERROR(SEARCH($M$4,E2),0 … +IFERROR(SEARCH($M$24,E2),0)>0,1,0)
This goes into a column to the left of our data. I also calculate the number of words in the phrase and if the phrase is a single character only (to remove it as noise obscuring the signal).
- Calculating words in a phrase: =LEN(TRIM(E2))-LEN(SUBSTITUTE(E2,” “,””))+1
- Calculating if a single character: =IF(LEN(E2)<2,1,0)
I also calculate the difference between the CTR for the Avg ranking position and the expected CTR based on industry averages, which I’ve written about before. That allows me to calculate the “Click opportunity,” or number of available clicks for my time period should I reach position one with either the expected CTR for position one (c22.96%) or my current improvement on avg CTR rate for my ranking plus the avg CTR for position one.
(This means that, in essence, if I’m clicked on at a higher rate than average while I’m in position three, for example, I’ll retain that difference while ranking in position one.)
How do we calculate those items? Well, assuming we have a difference Vs Avg. CTR calculated (read my old posts to work out how to get to that), then the following can calculate if you have a better-than-Avg CTR and what the improved clicks would be based on the impression numbers for the search term.
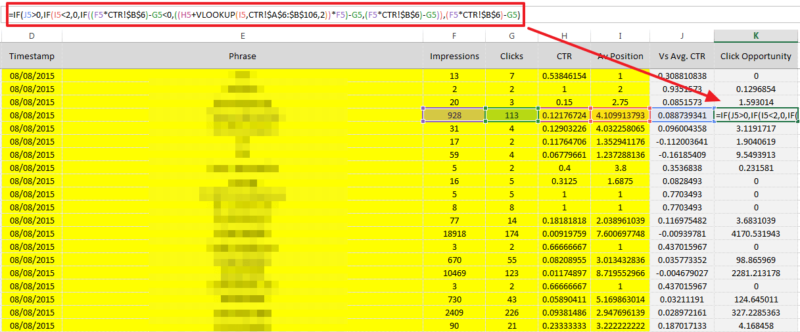
- Calculating click improvement: =IF(J5>0,IF(I5<2,0,IF((F5*CTR!$B$6)-G5<0,((H5+VLOOKUP(I5,CTR!$A$6:$B$106,2))*F5)-G5,(F5*CTR!$B$6)-G5)),(F5*CTR!$B$6)-G5)
Now, we get our pivot table out and create a slice of the data we want to analyze.

You can see that we are using our calculated columns to filter out brand variations and any single-character phrases, and look at all wordcount phrases. We’re looking at just one datestamp period, and given you can be as granular as you like with your API calls here, it’s up to you how much resolution you want here. Typically, I’d never go for more than a week as a time window, and month-long periods are also very valid.
I like to create a new tab to refer back to my pivot table data, as refreshing a pivot table will mess with any formatting you include; if you’re creating a regular report, you’ll appreciate avoiding those wasted hours reformatting everything when you refresh all pivots!
Below is a view of how this tool can then show real insight when we compare two (or more) date ranges, and start to look at longer-tail (3+ word) terms. Just by editing this one variable, we can create multiple windows on our CTR pain and focus our efforts on the highest Click Opportunity terms each time.
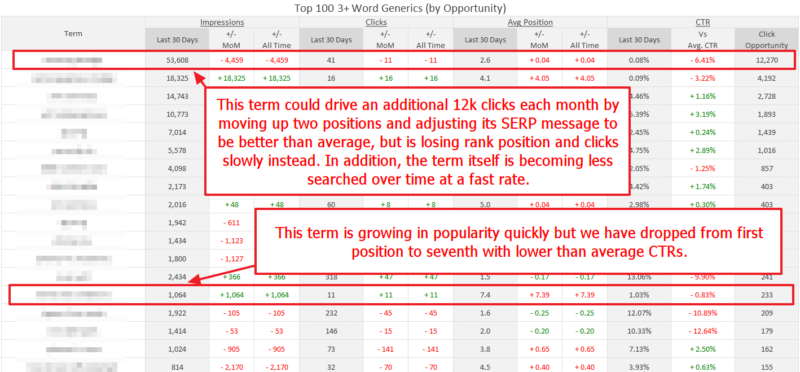
I like to also consider creating variations on this report to sort by highest impression volume, or greatest click gap opportunities, or greatest drop in CTR between two time periods and so on. It’s just a case of playing with the pivot table options at this point to find the biggest issues.
So, there you go. That’s how to break the 5,000-row limit in Search Console and really drill into your long-tail to find the most valuable pain points to spend your time fixing.
Contributing authors are invited to create content for Search Engine Land and are chosen for their expertise and contribution to the search community. Our contributors work under the oversight of the editorial staff and contributions are checked for quality and relevance to our readers. The opinions they express are their own.
Related stories
New on Search Engine Land
About the author