YP: 30 Percent Of Search Queries Now Coming From Mobile
Local search provider and online ad network YP has released its end of the year review report (.pdf). The data are drawn from a huge volume of queries on its PC destination site, its mobile site and apps, as well as its broader advertising network. YP says that 30 percent of its overall query volume […]

YP says that 30 percent of its overall query volume and lookups now come from mobile devices. However 100 percent of queries on the YP network are going to be local in nature given the property and the brand. While the data are not necessarily entirely representative of market-wide local search activity on the PC and in mobile they’re a pretty good proxy.
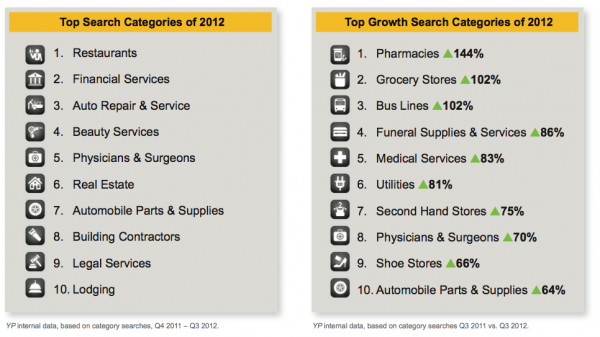
Once again, it seems perennially, the most searched local category is restaurants, which according to YP constituted 10 percent of all searches. The list on the left below contains the most searched local categories (across platforms) and the one on the right the highest growth local categories.
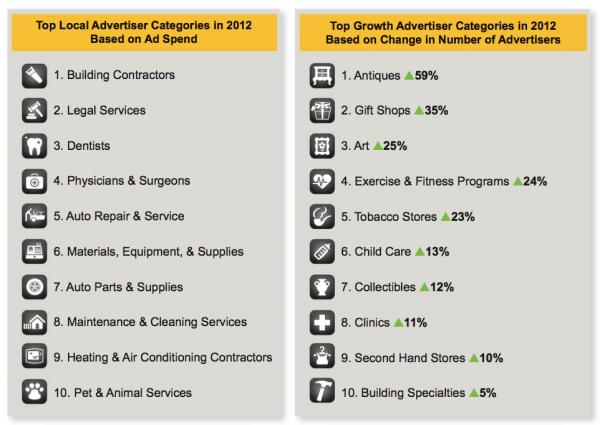
Compare the lists above to those below, reflecting the top local advertiser spending categories.
YP also reported the “most clicked” categories of 2012:
- Restaurants
- Auto Parts
- Building Contractors
- Physicians & Surgeons
- Legal Services
- Auto Repair and Service
- Pet & Animal Service
- Real Estate
- Automobile Sales
- Financial Services
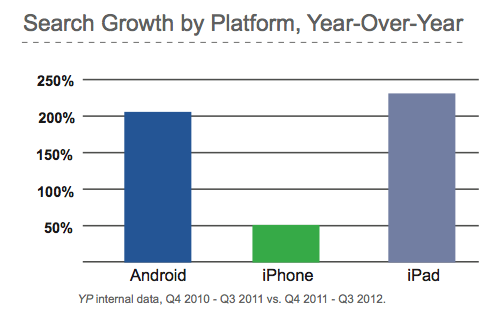
YP said that the highest local-mobile search growth on its network came from Android devices and the iPad. The company explained that “The number of iPad searches grew 233% compared to the prior year. Searches on Android devices increased 205%. iPhone searches grew as well, up 58% compared to the prior year.”
Another very interesting set of data released involves click-to-call ratios. In the left column below are the categories in which fewer clicks generated more calls, while on the right it took more clicks to generate calls. Accordingly people were more inclined to call the business categories on the left below and less inclined to make phone calls to the categories in the right column.
One could argue that in the left column consumers wanted services or information immediately — including price quotes or bids — whereas in the right column information on a website was sufficient (hours, locations, etc.).
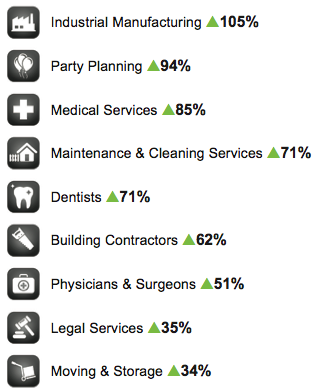
Finally YP points out that, notwithstanding the dominance of restaurant search, mobile is becoming a more mainstream way to find information of all types. The company identified categories “not related to proximity or urgency” (typical local-mobile triggers) that showed significant growth on mobile devices.
Contributing authors are invited to create content for Search Engine Land and are chosen for their expertise and contribution to the search community. Our contributors work under the oversight of the editorial staff and contributions are checked for quality and relevance to our readers. The opinions they express are their own.
Related stories


