The SEO’s guide to Google Search Console
Dive into Google Search Console's features and reports, plus how to navigate the tool like a pro, from basic setup to advanced SEO analysis.
Google Search Console (GSC) is a free gift from Google to SEO professionals that tells you how your website is performing.
With data-packed amenities, SEOs can scavenge through GSC to locate stashes of hidden nuggets like clicks and impressions from search queries, Core Web Vitals and whatever other surprises lay within your website.
Custom regex filters take you around your million-page website.
And while all SEO professionals hope to avoid any catastrophic SEO-related events with Google’s AI Overviews, all we can really do is be prepared.
For starters, keep reading this guide below to Google Search Console. It’s engineered to withstand zombie pages, panda claws and even penguin attacks, so it’s exactly what you need when the SEO industry gets dicey.
What does Google Search Console do? And how does it help SEO?
Google Search Console is a free website analytics tool Google provides. Google Search Console tracks your website’s performance in search results on Google.
As an SEO director, I use Google Search Console daily. I check website performance for content updates and troubleshoot any technical changes. It helps me make informed business decisions about where to dedicate my team.
How do I set up Google Search Console?
Getting set up on Google Search Console is quick and easy but may require technical support.
First, you need to have a Google account.
Next, go to Google Search Console: https://search.google.com/search-console.
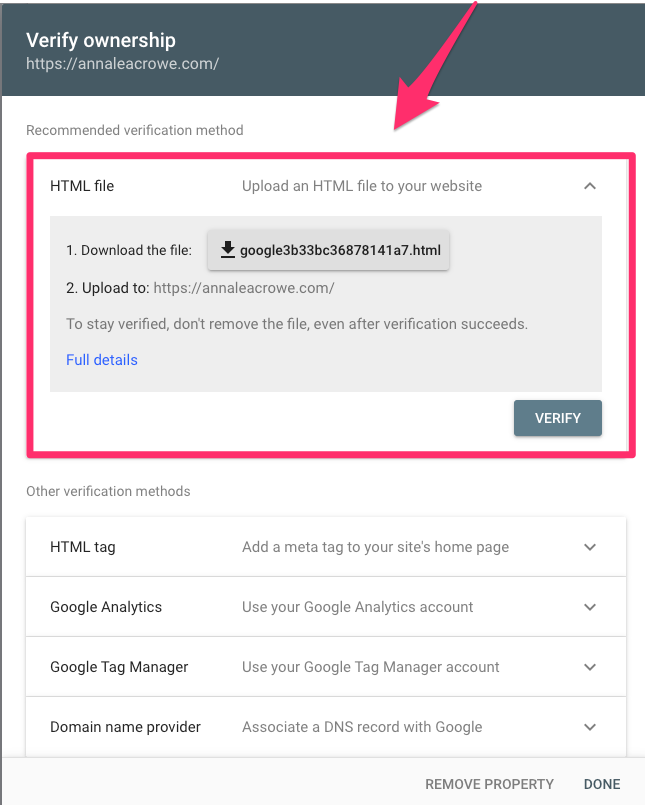
If you don’t see any profiles listed, you’ll need to choose a domain or prefix URL and verify your website ownership.
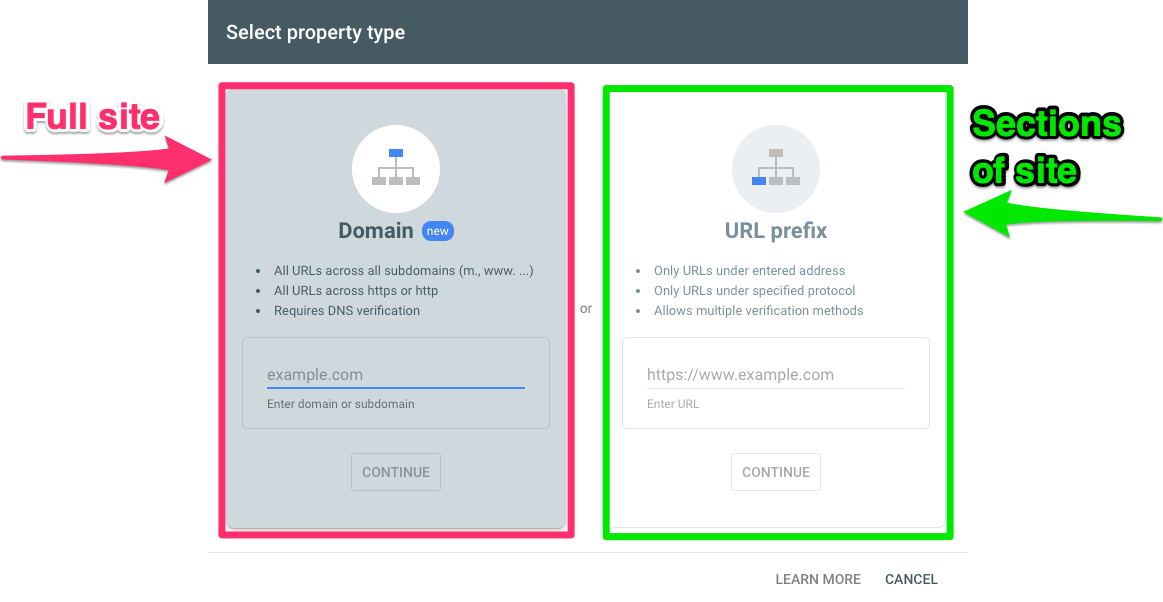
How do you choose between domain vs. prefix URL? Let me walk you through the differences.
Domain property paints the full picture of your website
A domain property includes all subdomains but no protocols (HTTP:// or HTTPS://) and no path strings (/sub/folder/).
A domain property provides a holistic view of how your website is performing Google search results.
I recommend setting up domain properties first.
To set up a domain property in Google Search Console, remove the HTTPS and trailing slashes.
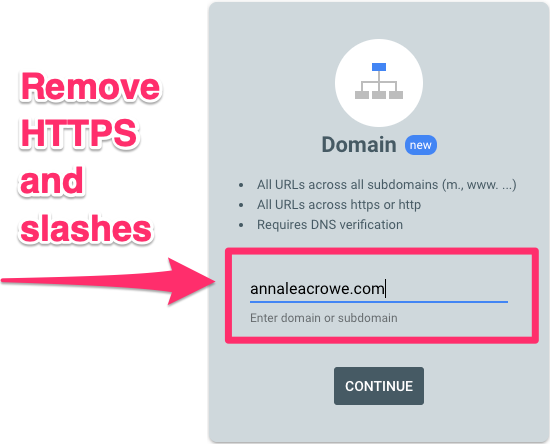
GSC website domain
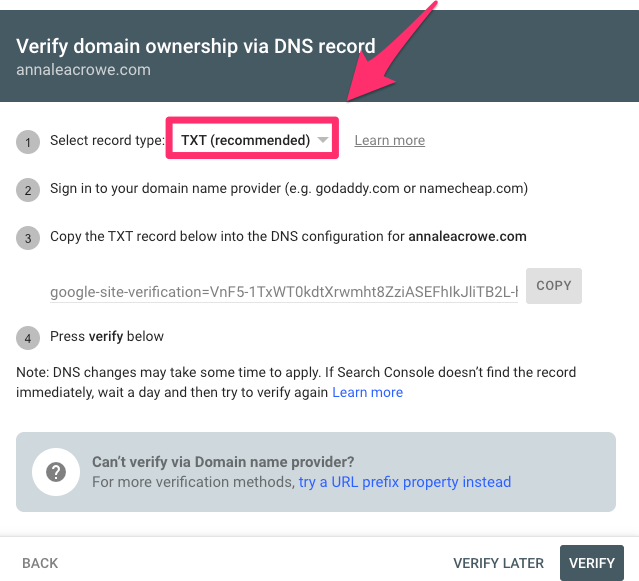
After you hit continue, you can verify your ownership via DNS record through TXT files.
I recommend going this route as it is the easiest.
You’ll need to log into your hosting provider to submit the TXT file.
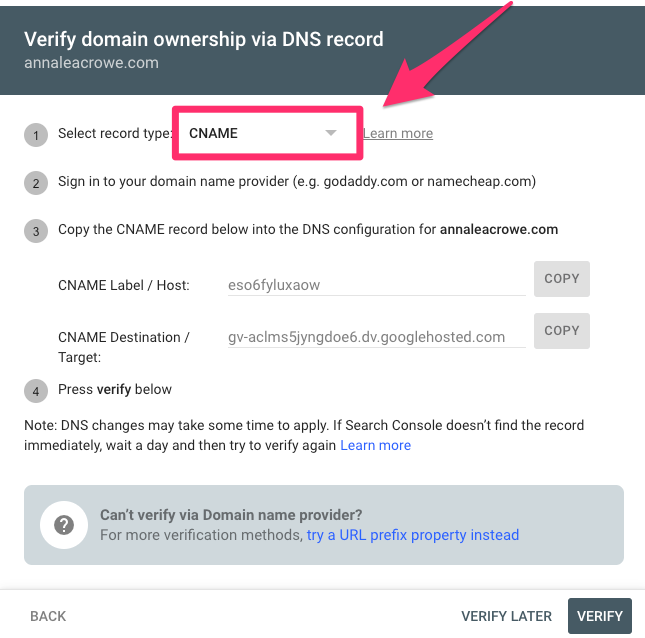
Another option is to verify through the CNAME. If you have technical support, this could be an easy alternative.
URL prefix property allows you to dissect sections of a site
A URL prefix property includes the HTTPS or HTTP protocol and path string. This means that if you want to really dive into a section of your website like /blog/ subfolder or a blog.website.com subdomain, you can do this.
After I set up my domain property, I set up individual URL prefix properties for each subdomain, HTTP versions and /blog/ subfolders.
By having multiple URL prefix properties, I can dig deeper into sections of the website to help troubleshoot.
I can also create reporting specific to the website’s sections that may be more relevant to my co-workers.
For example, I work with customer support team members looking for data on how their Help Center content is performing.
Key moments in history for Google Search Console
Some really crazy stuff has happened with Google Search Console over time. Google Search Console is notorious as a delicacy for many SEO professionals, an incessant phantom of manual actions and the culprit behind better understanding our website health.
I’ve compiled a short history of my SEO bromance with Google Search Console over the years to give you a glimmer of how we got here.
- June 2005: Google Webmaster Tools (now called Google Search Console) was launched.
- May 20, 2015: Google changed the name to Google Search Console from Google Webmaster Tools.
- June 21, 2016: Google Search Console tests new mobility usability report.
- Sept. 6, 2016: Google Search Console improves Security Issues report.
- Sept. 8, 2018: Google Search Console released Manual Actions report, “Test Live,” and request indexing features added for the URL inspection tool and upgraded to 16 months of historical data.
- Nov. 8, 2018: Google experiments with domain properties.
- June 26, 2019: Google Search Console adds mobile-first indexing features.
- May 27, 2020: Google Search Console adds Core Web Vitals report.
- Nov. 22, 2021: Google Search Console rolls out new design.
- Sept. 14, 2022: Google Search Console launches new HTTPS report.
- Nov. 16, 2022: Google Search Console adds Shopping tab listings feature.
- Sept. 11, 2023: Google Search Console rolls out new Merchant Center integrated reports.
- Nov.r 15, 2023: Google released a new robots.txt report.
- The future: New Google AIO reports will be coming soon!
Breakdown of Google Search Console for SEOs
While some SEO professionals may be waiting in the tunnels for Skynet and AIO to take over, there’s one thing we can all still depend on: Google Search Console.
So before you join your freelance mission with SEAL Team 6, walk through the anatomy of Google Search Console.
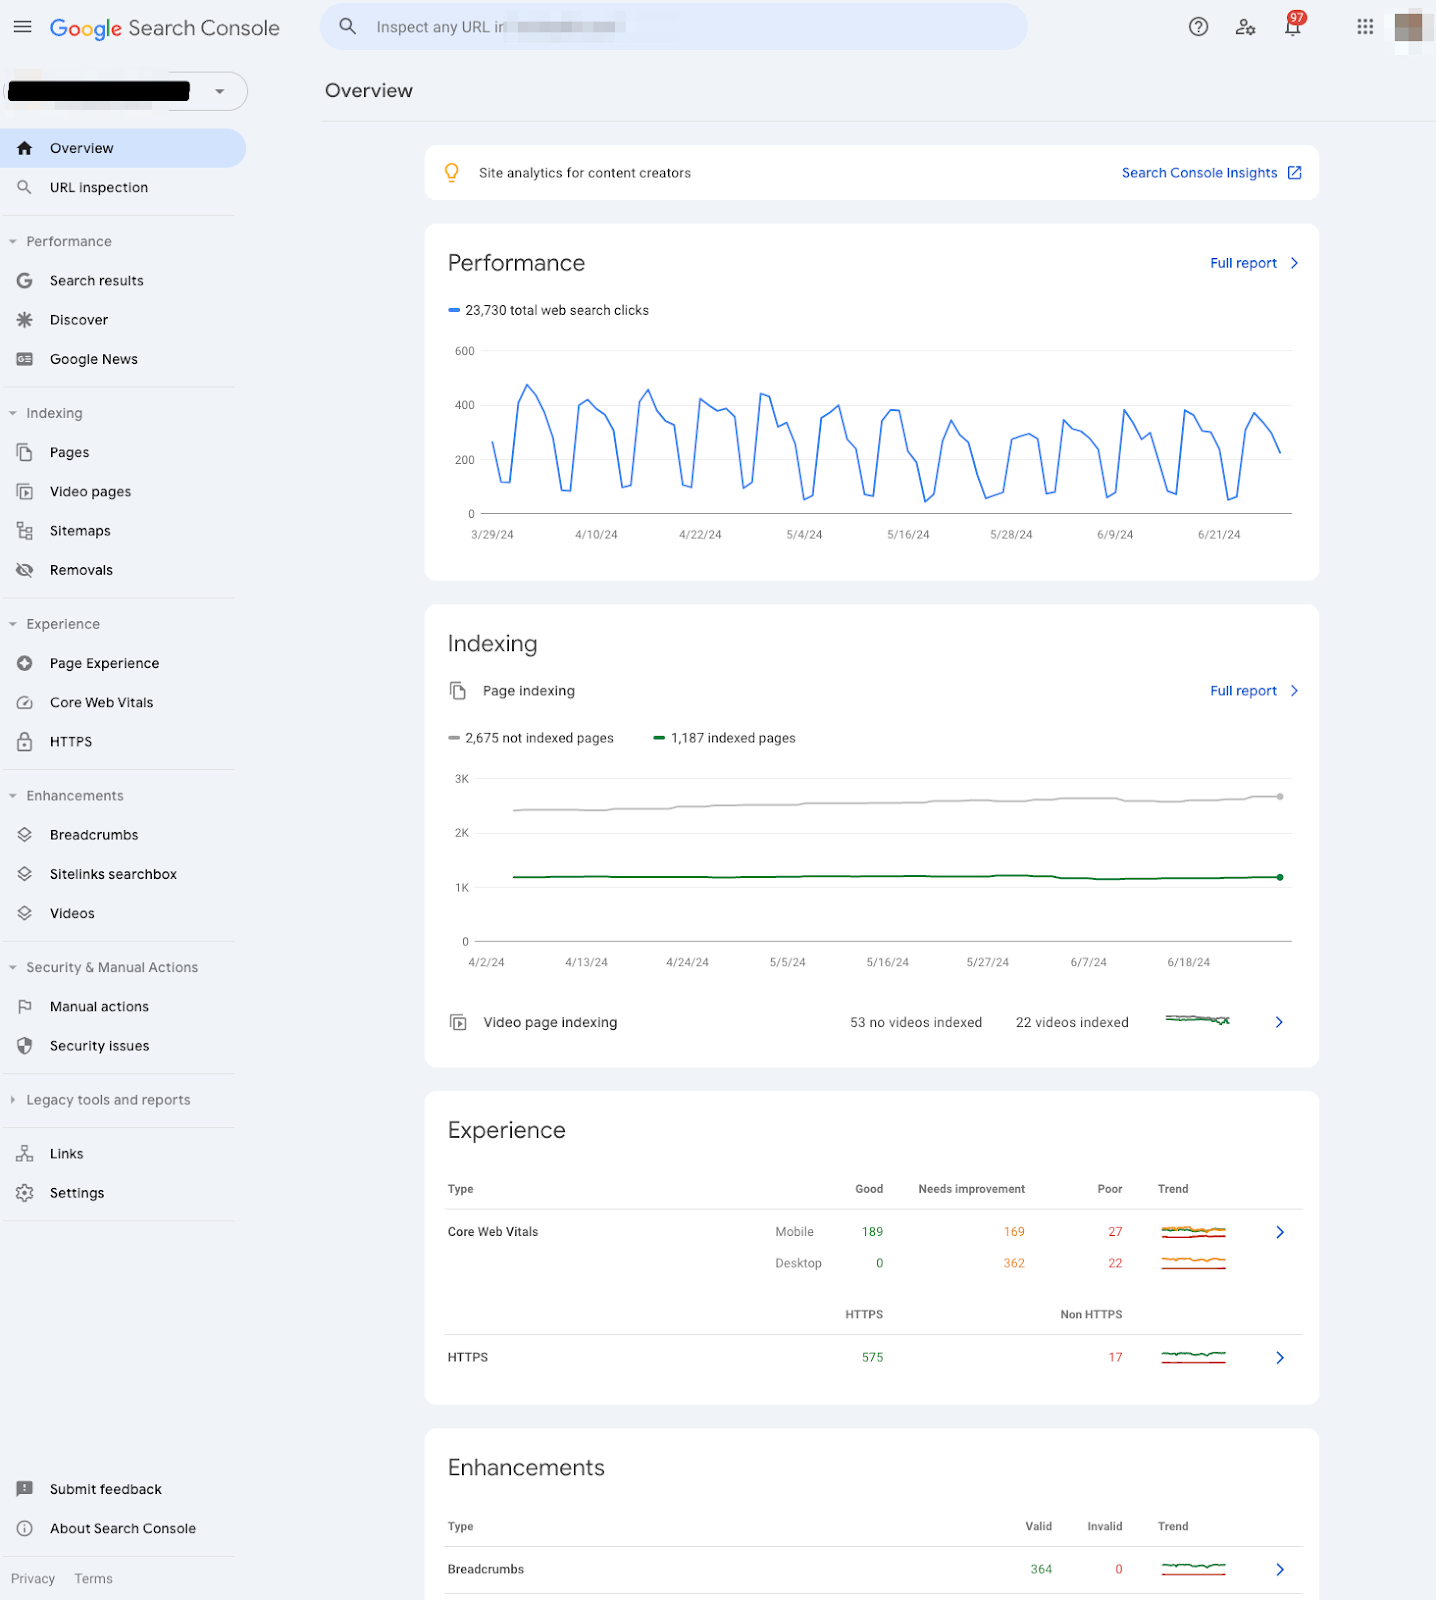
Overview
The Overview section in Google Search Console provides a bird’s eye view of all data sets users can uncover in Google Search Console.
Search Console Insights
If you click the top section under “Search Console Insights,” you’ll see a snapshot of the past 28 days.
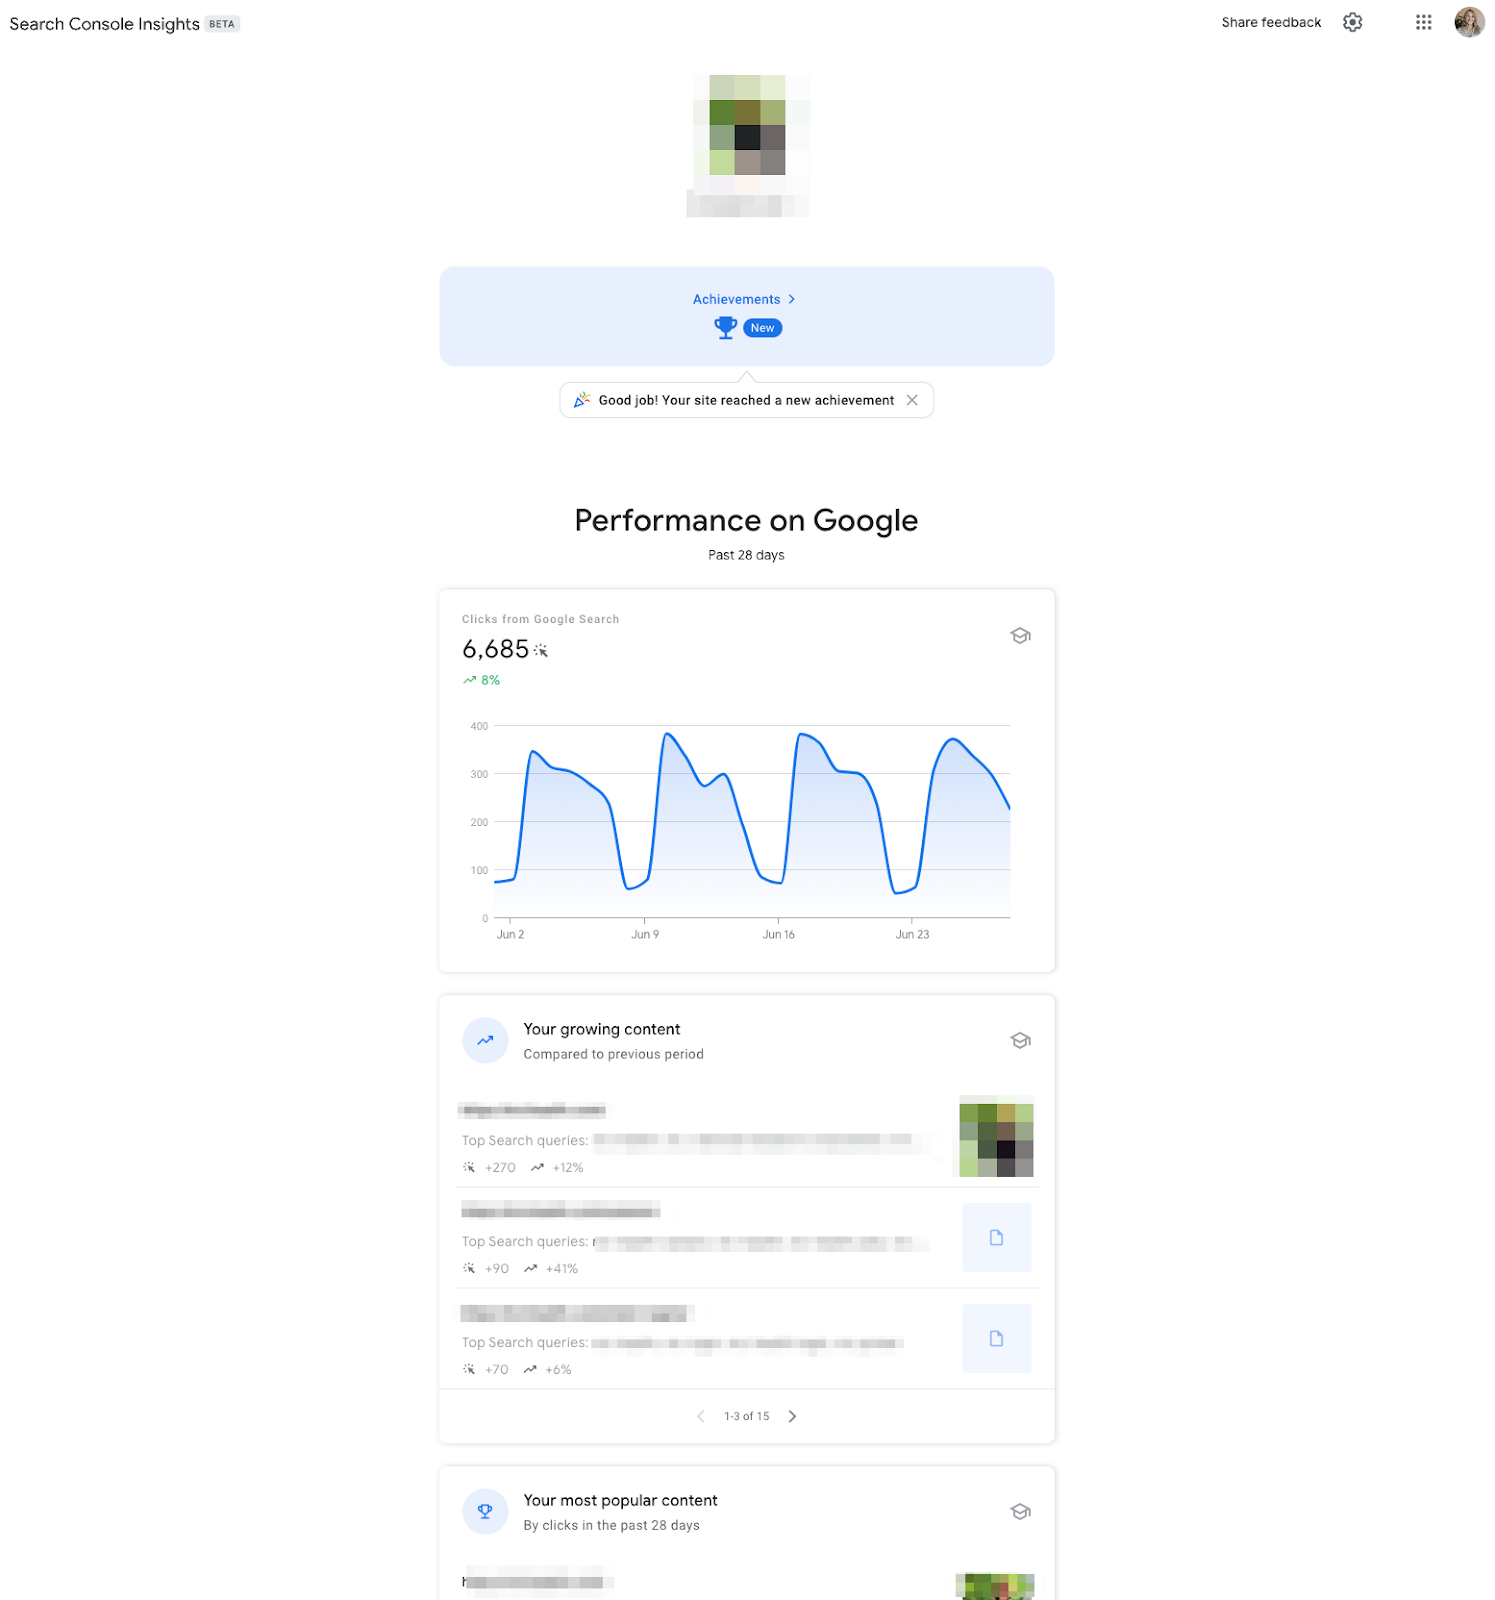
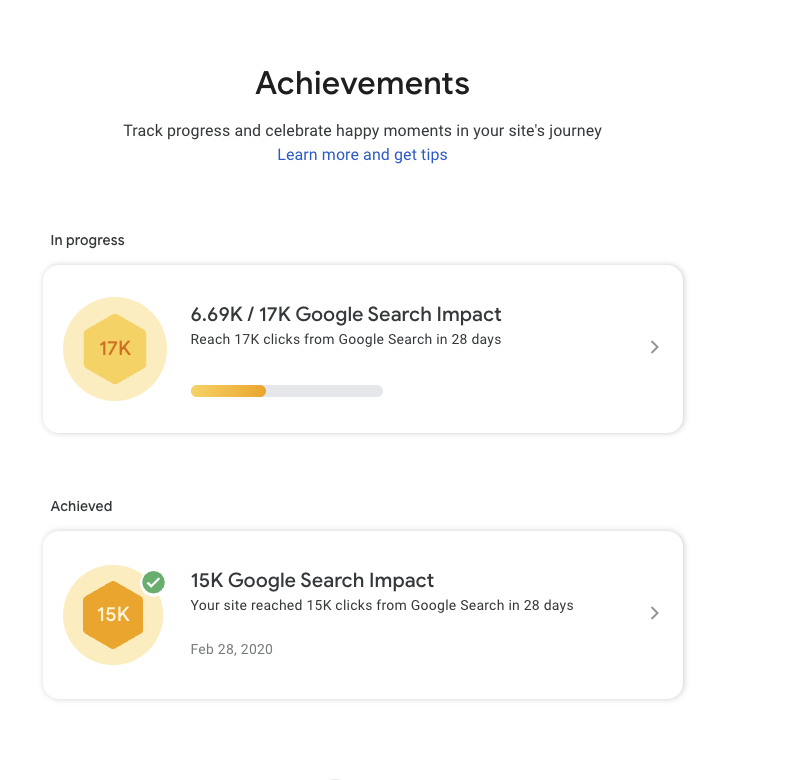
It gives you a high-level overview of achievements you can share with your client or team.
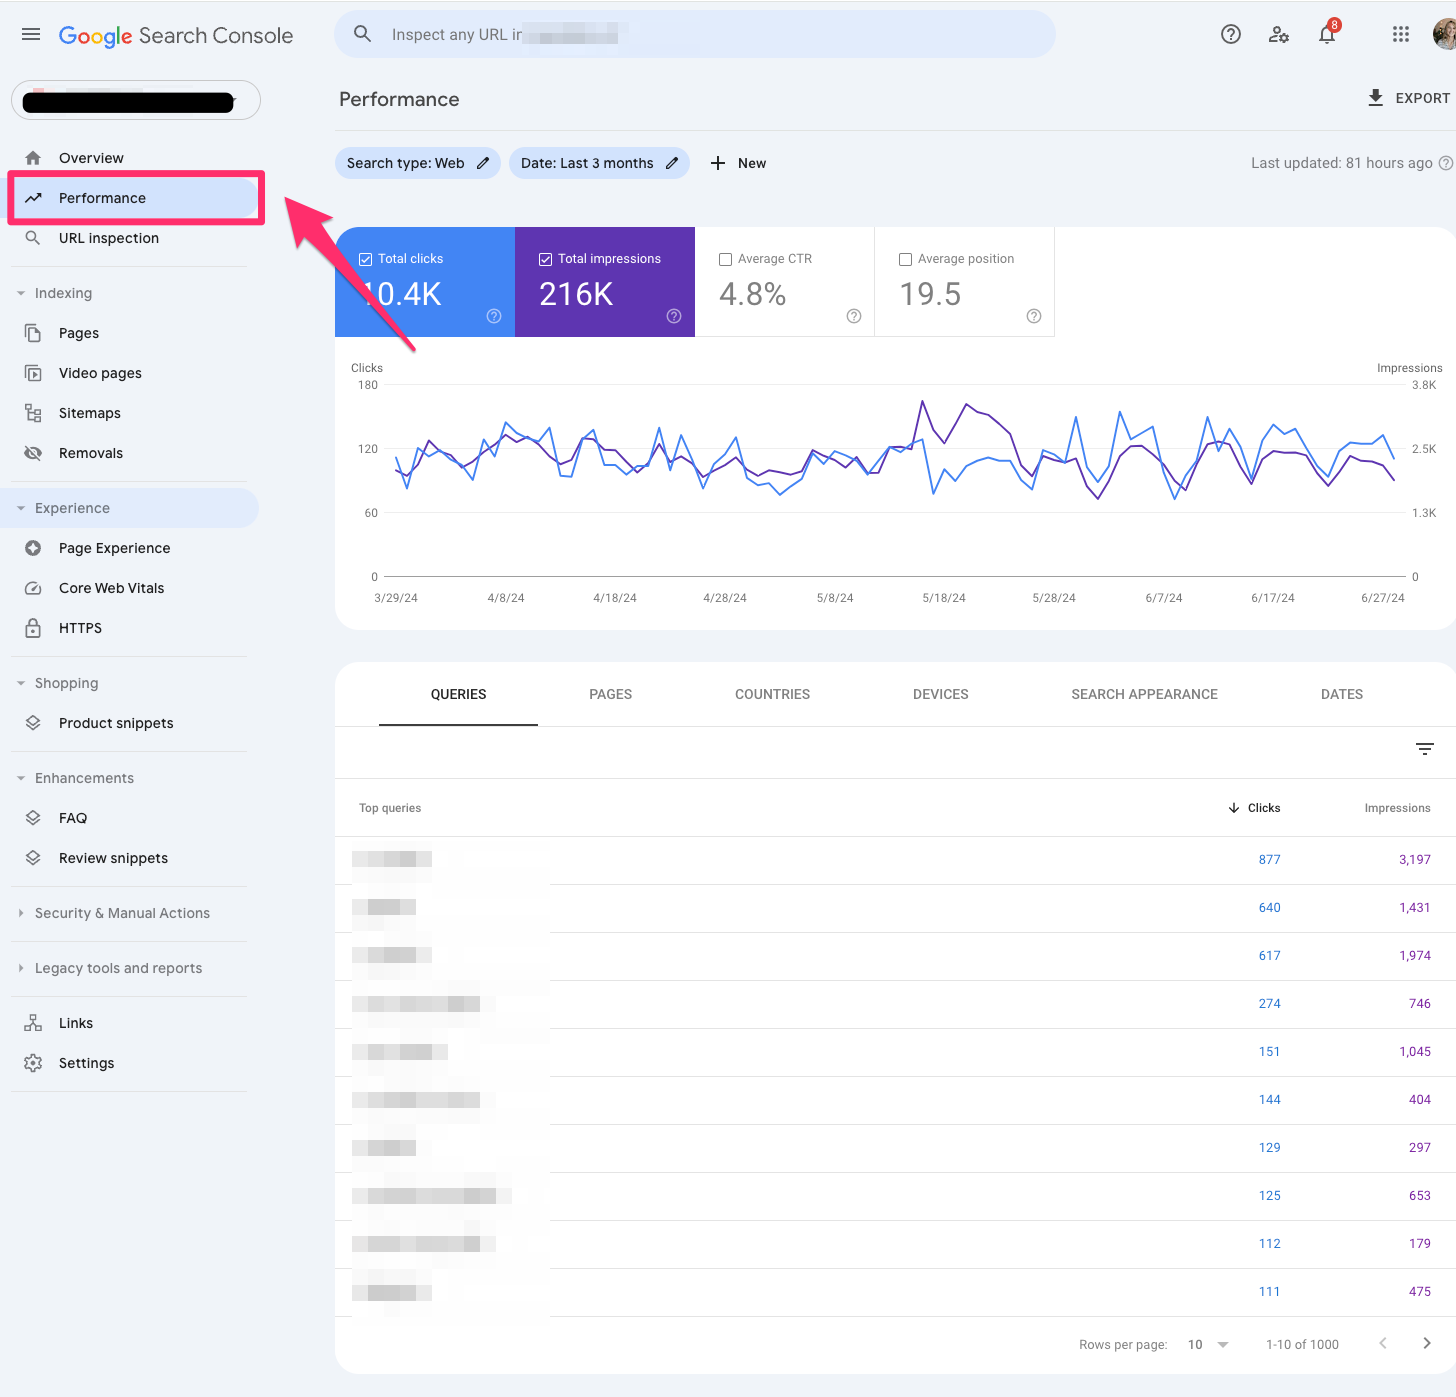
Performance
The performance section is also called the “search results” section.
On my end, I only see this called “Performance” under some of my international sites, specifically in China.
Similar to the “search results” section found below, the “Performance” section showcases metrics like search traffic over time, search queries, search queries based on mobile devices and page performance.
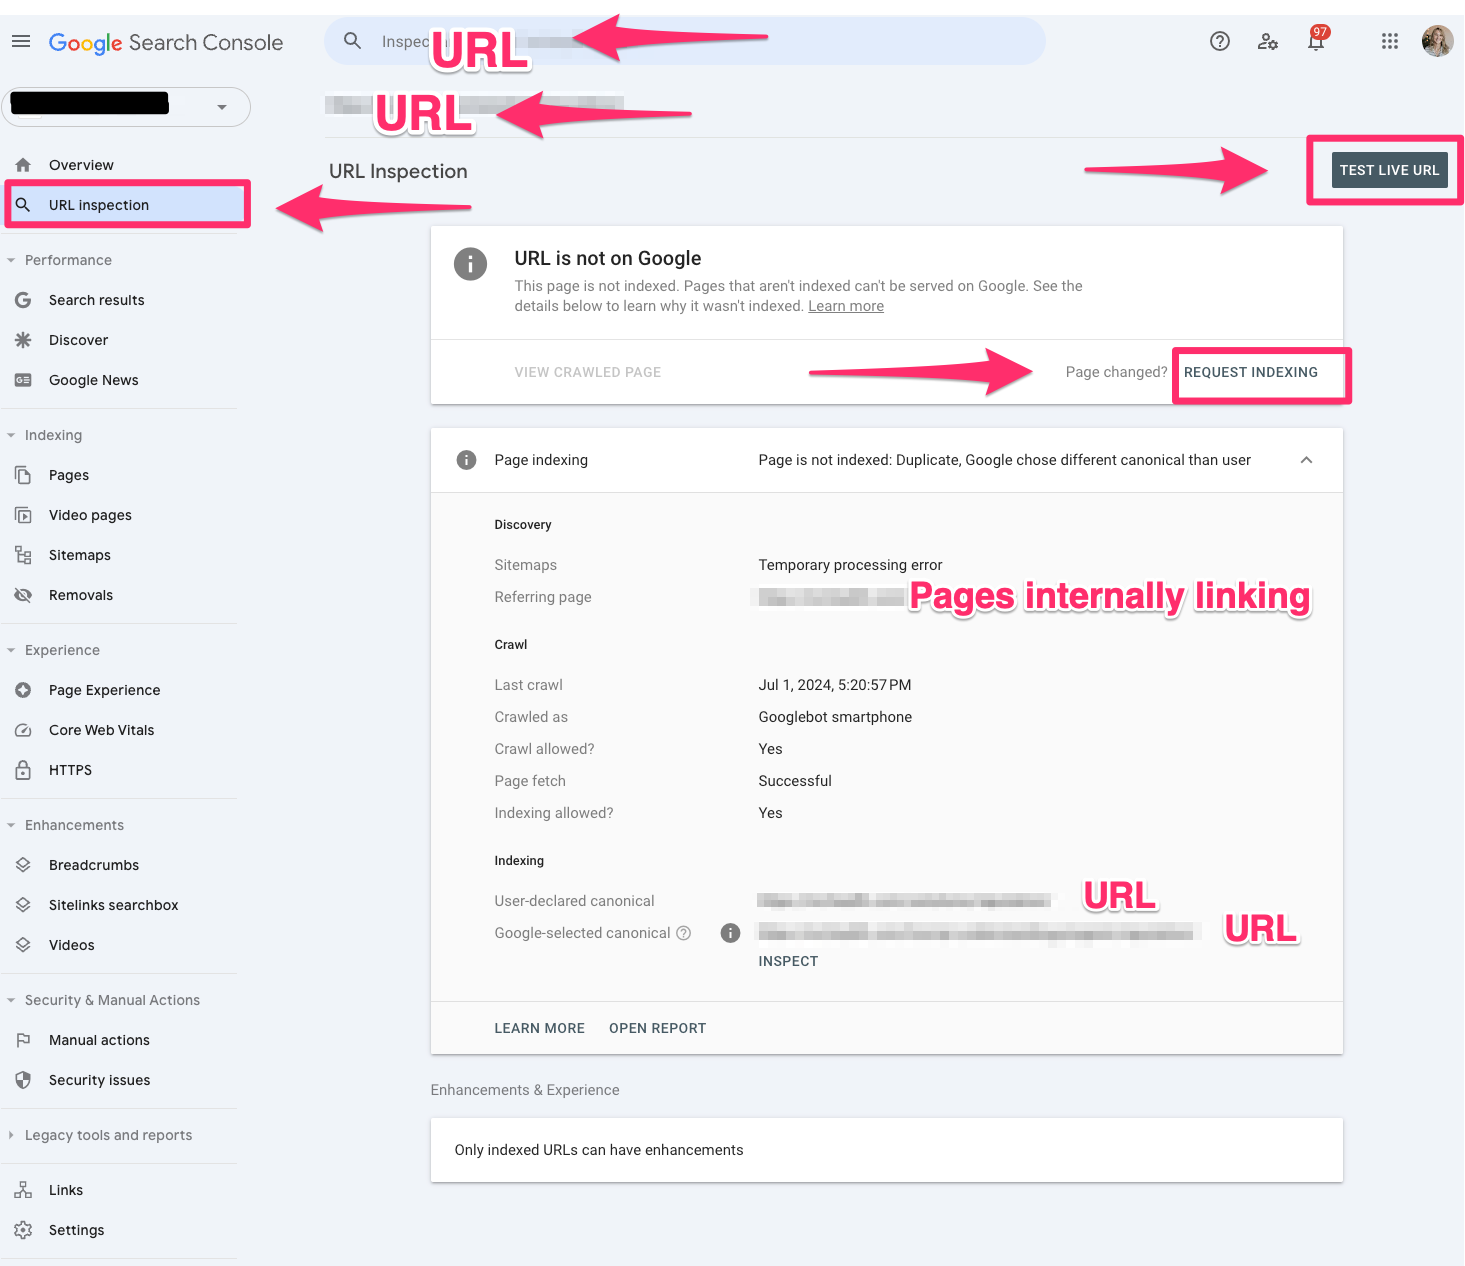
URL inspection
The URL inspection tool lets you see what Google sees per URL.
The URL inspection tool is one of my favorite SEO tools.
Unfortunately, today, you can only inspect one URL at a time. However, if you use the Search Console URL inspection API, you can test up to 2000 URLs per day.
The test will show if the URL is indexable and explain why it may or may not be indexed.
You can also request a URL be indexed.
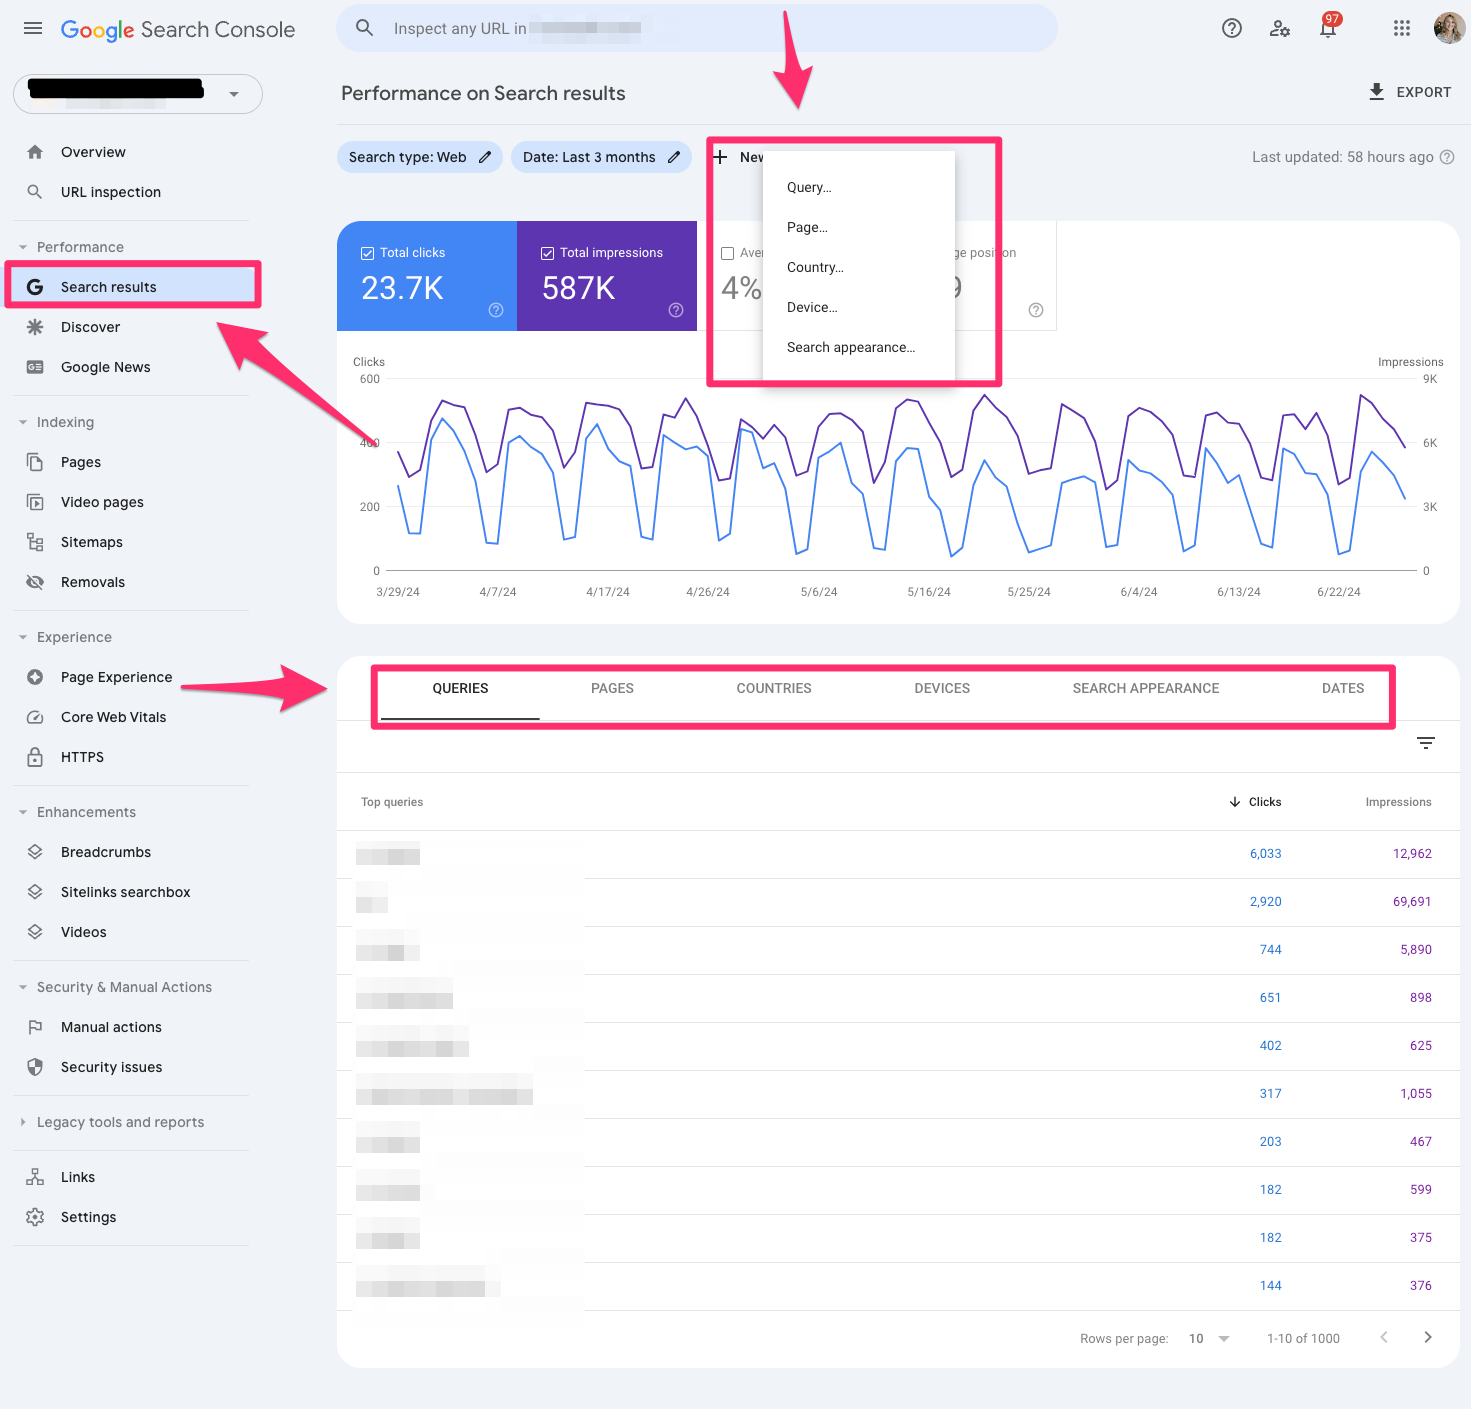
Search results
Search results are every content marketer’s favorite report in Google Search Console. It shows search traffic over the past 16 months (with comparisons) and search queries, devices, counties and search appearances.
It will also show you which pages are ranking for certain queries.
I leverage this report to show which pages are performing best vs. worst. It also helps troubleshoot if there are any major drops or spikes in traffic.
You can segment this report based on clicks, impressions and CTR.
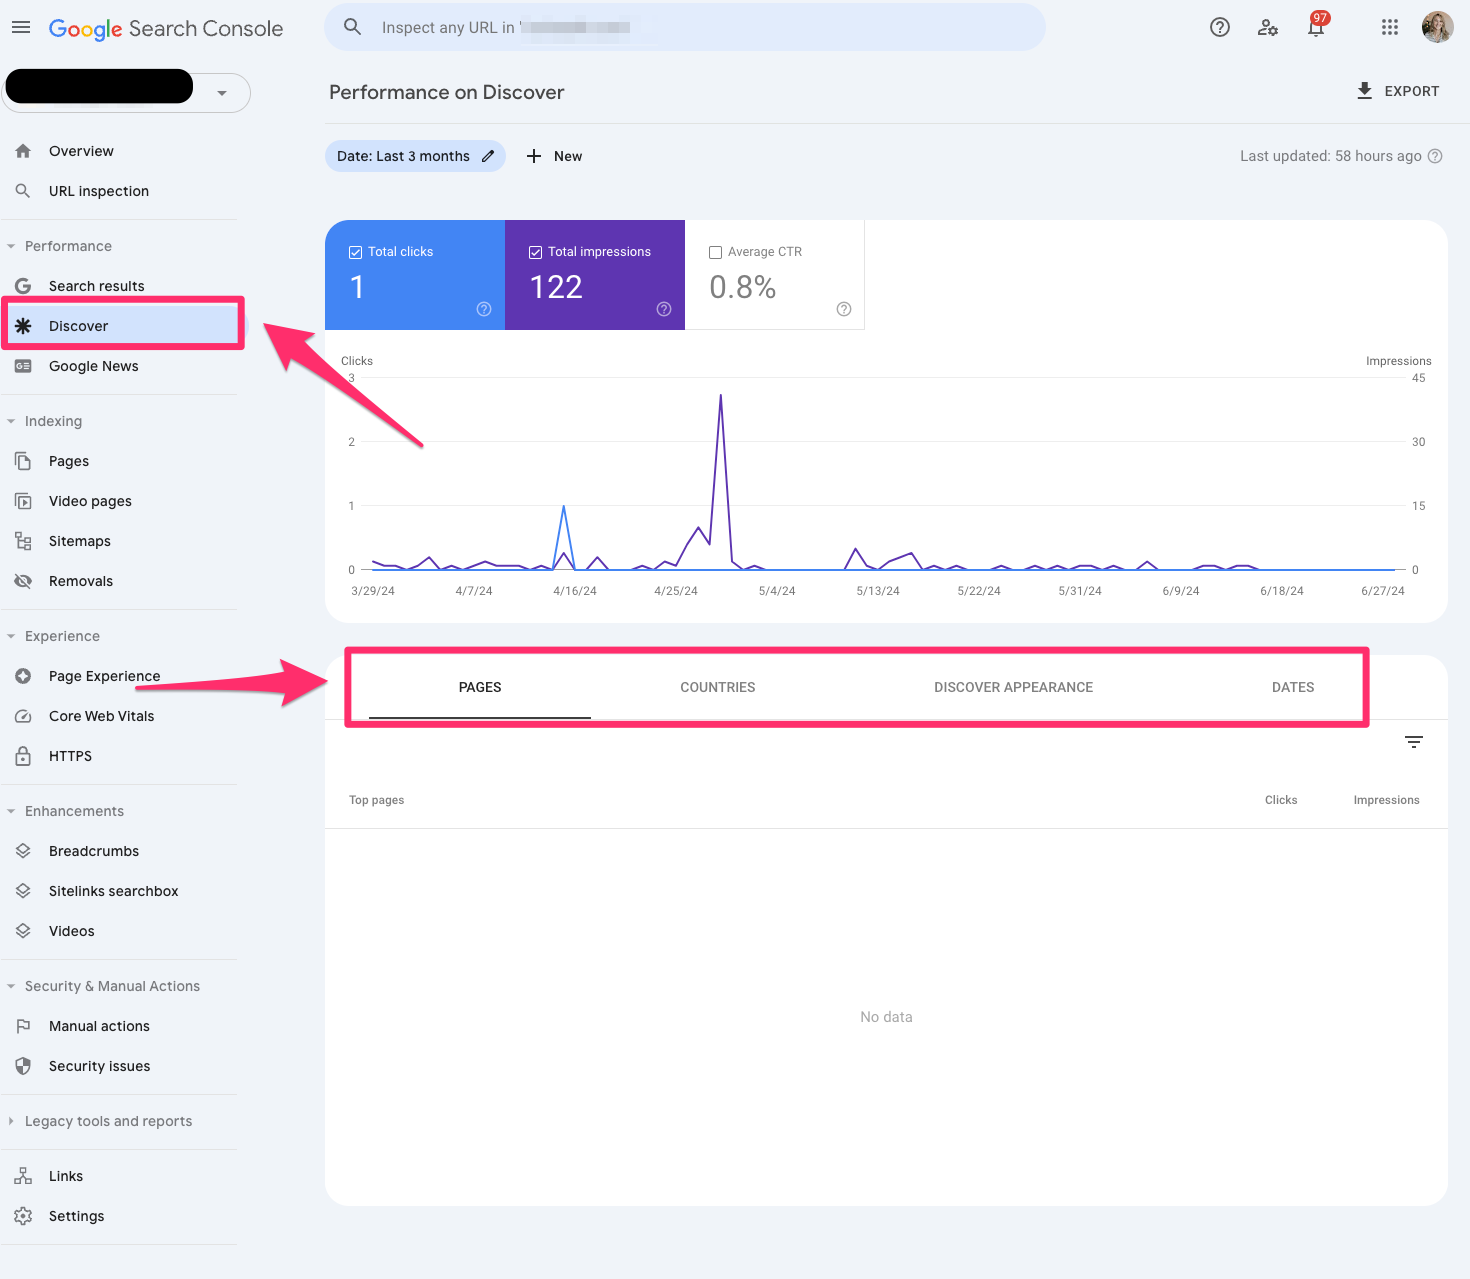
Discover
The Discover report in Google Search Console showcases your content’s performance in Google’s Discover feed.
You can filter by pages, countries, search appearances and devices like the search results report.
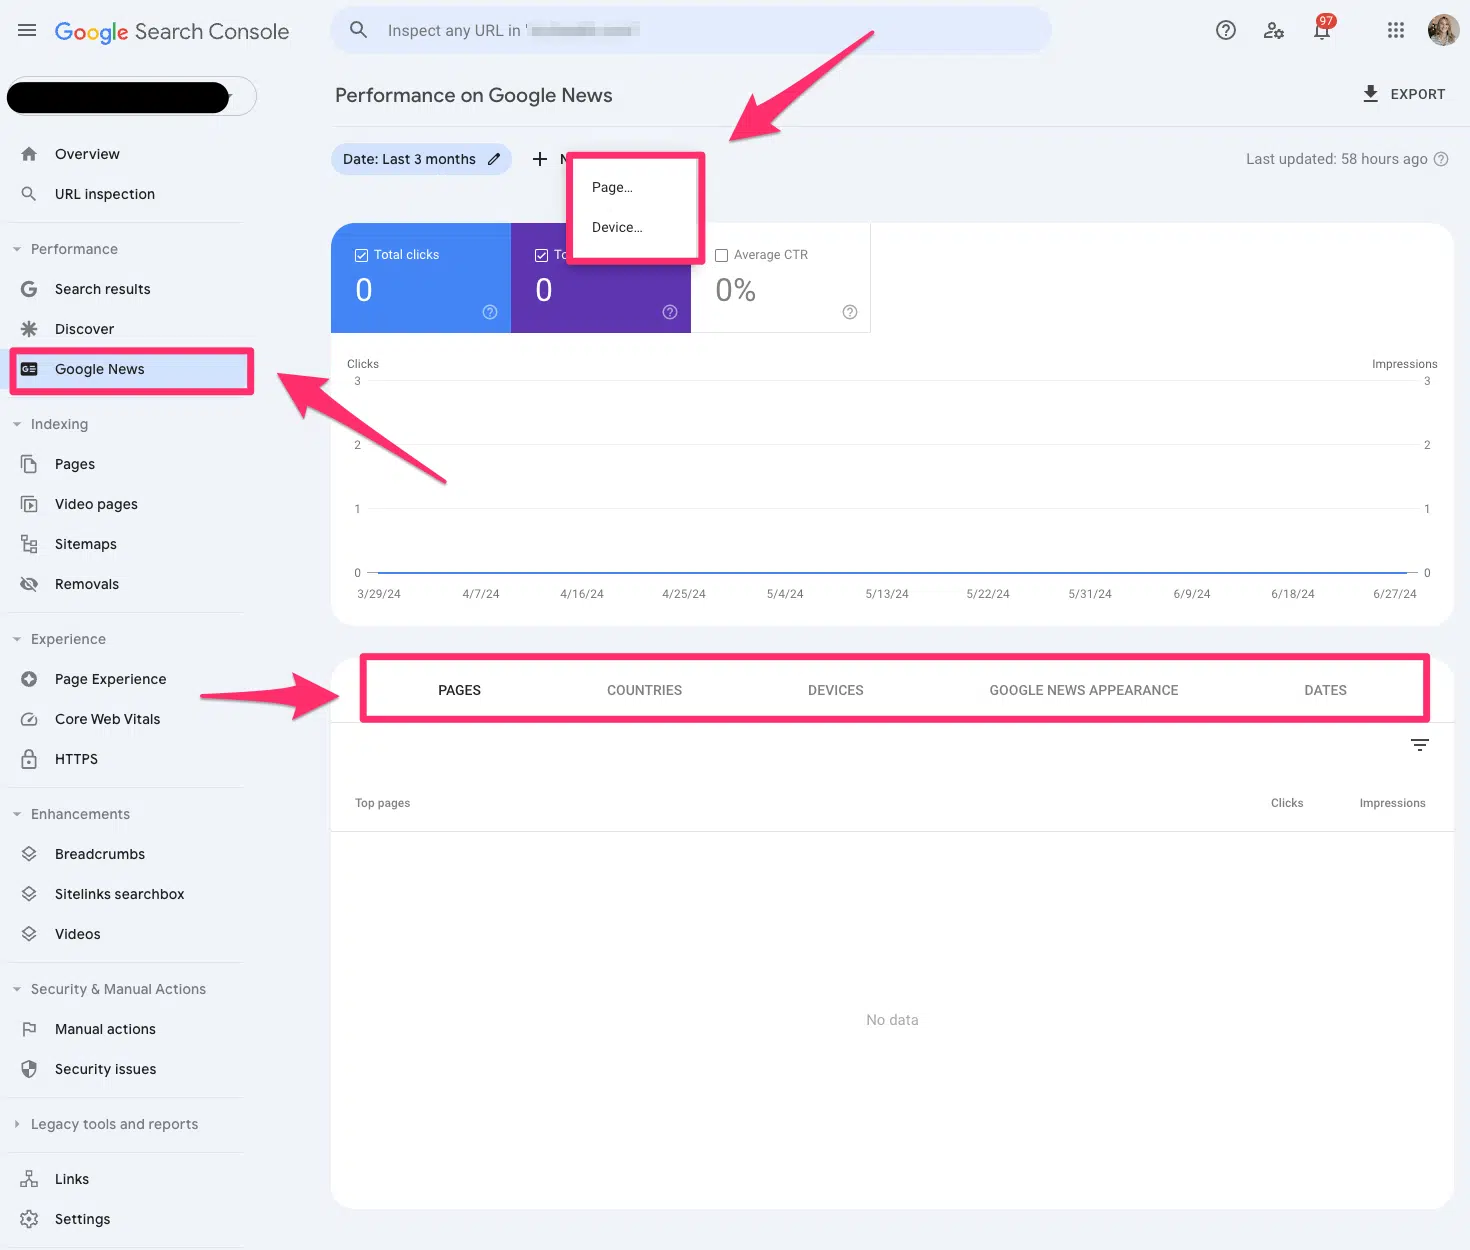
Google News
The Google News report in Google Search Console tells you how your content performs under Google News in Google search results.
You can filter the report by page and device.
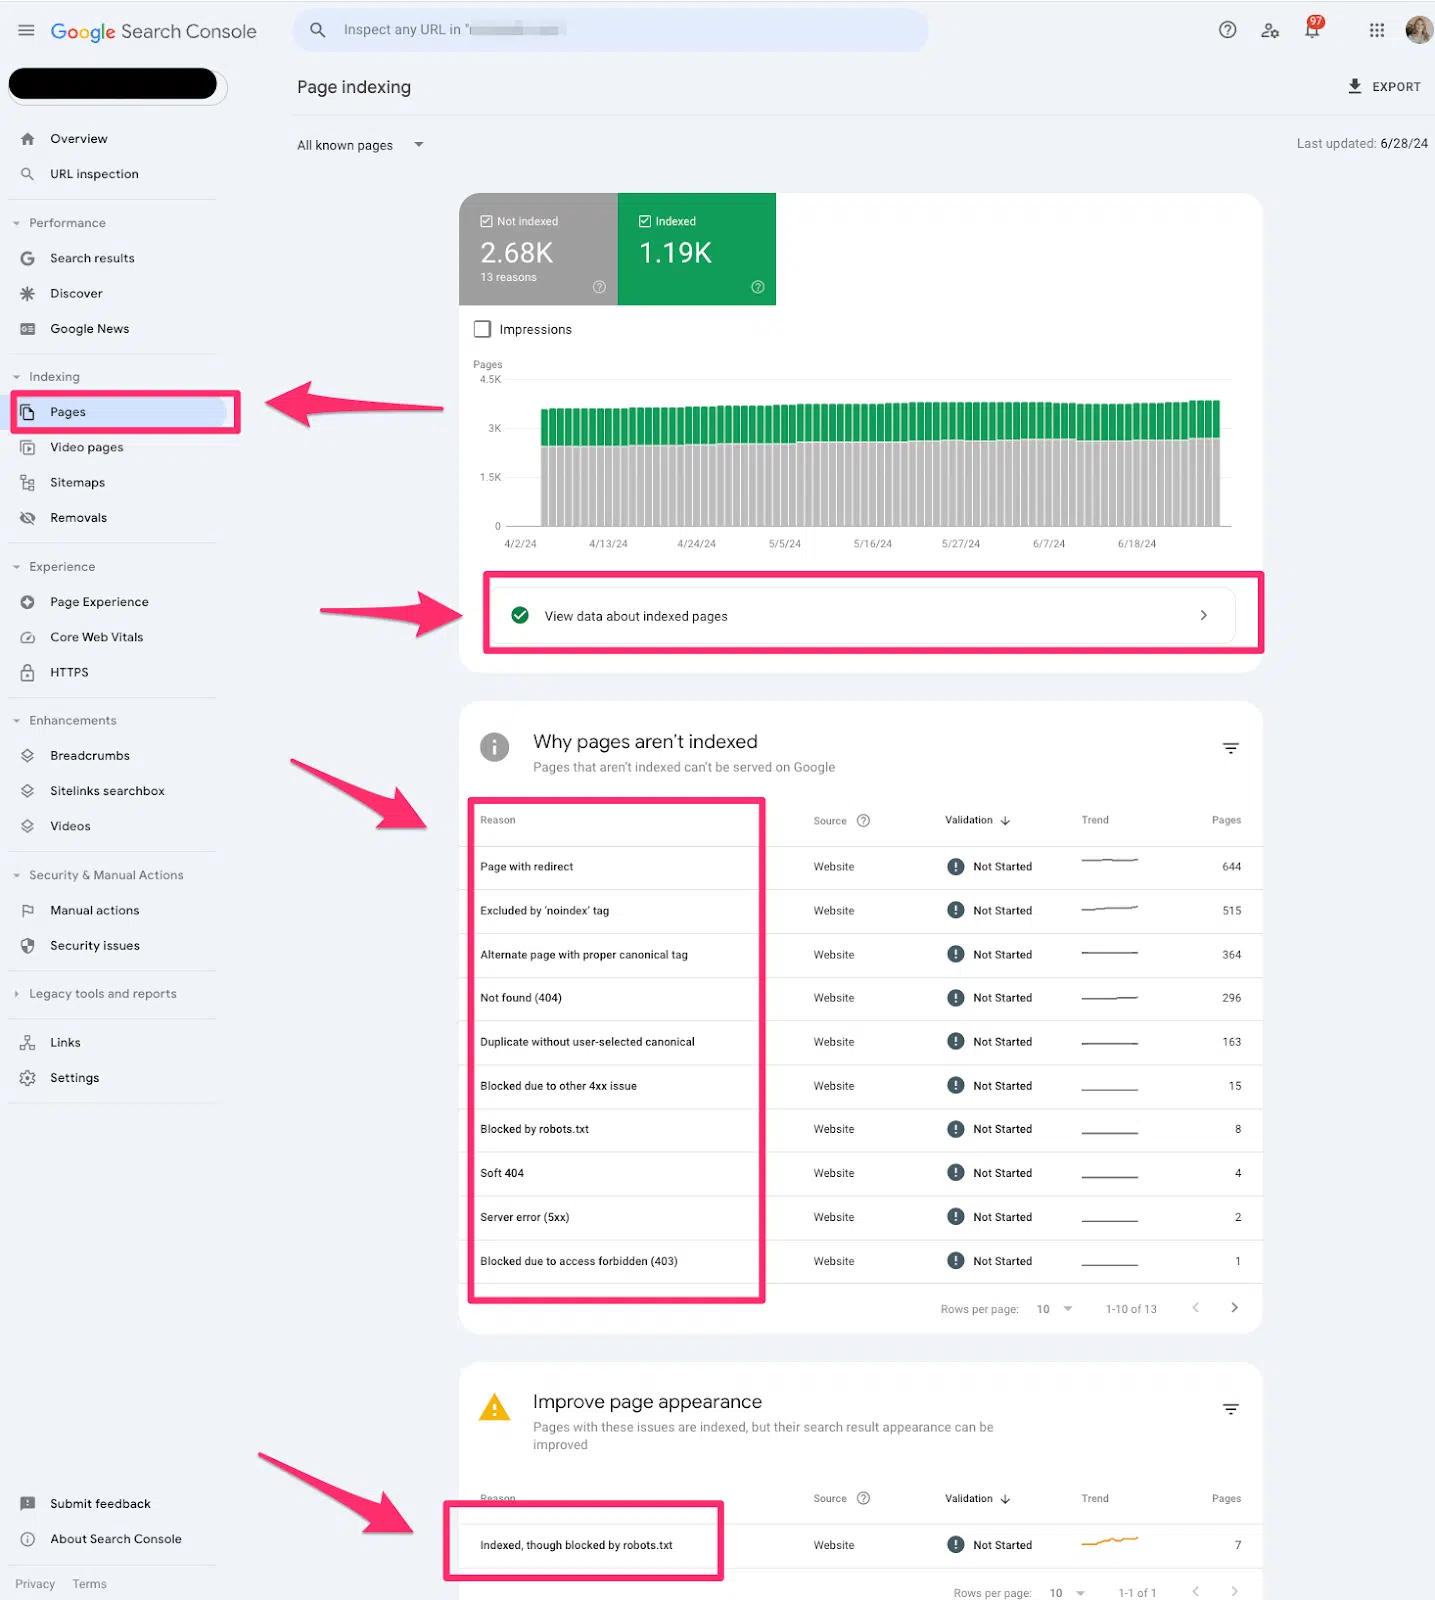
Pages
Pages indexing report in Google Search Console shares which pages in Google can find (or not find) on your website.
The Pages report is valuable for every technical SEO. This report offers tons of quick wins for technical SEO. I always like to start with this section when I’m auditing a website.
If you see an increase in pages indexed or not indexed, you’ll want to investigate why it’s happening.
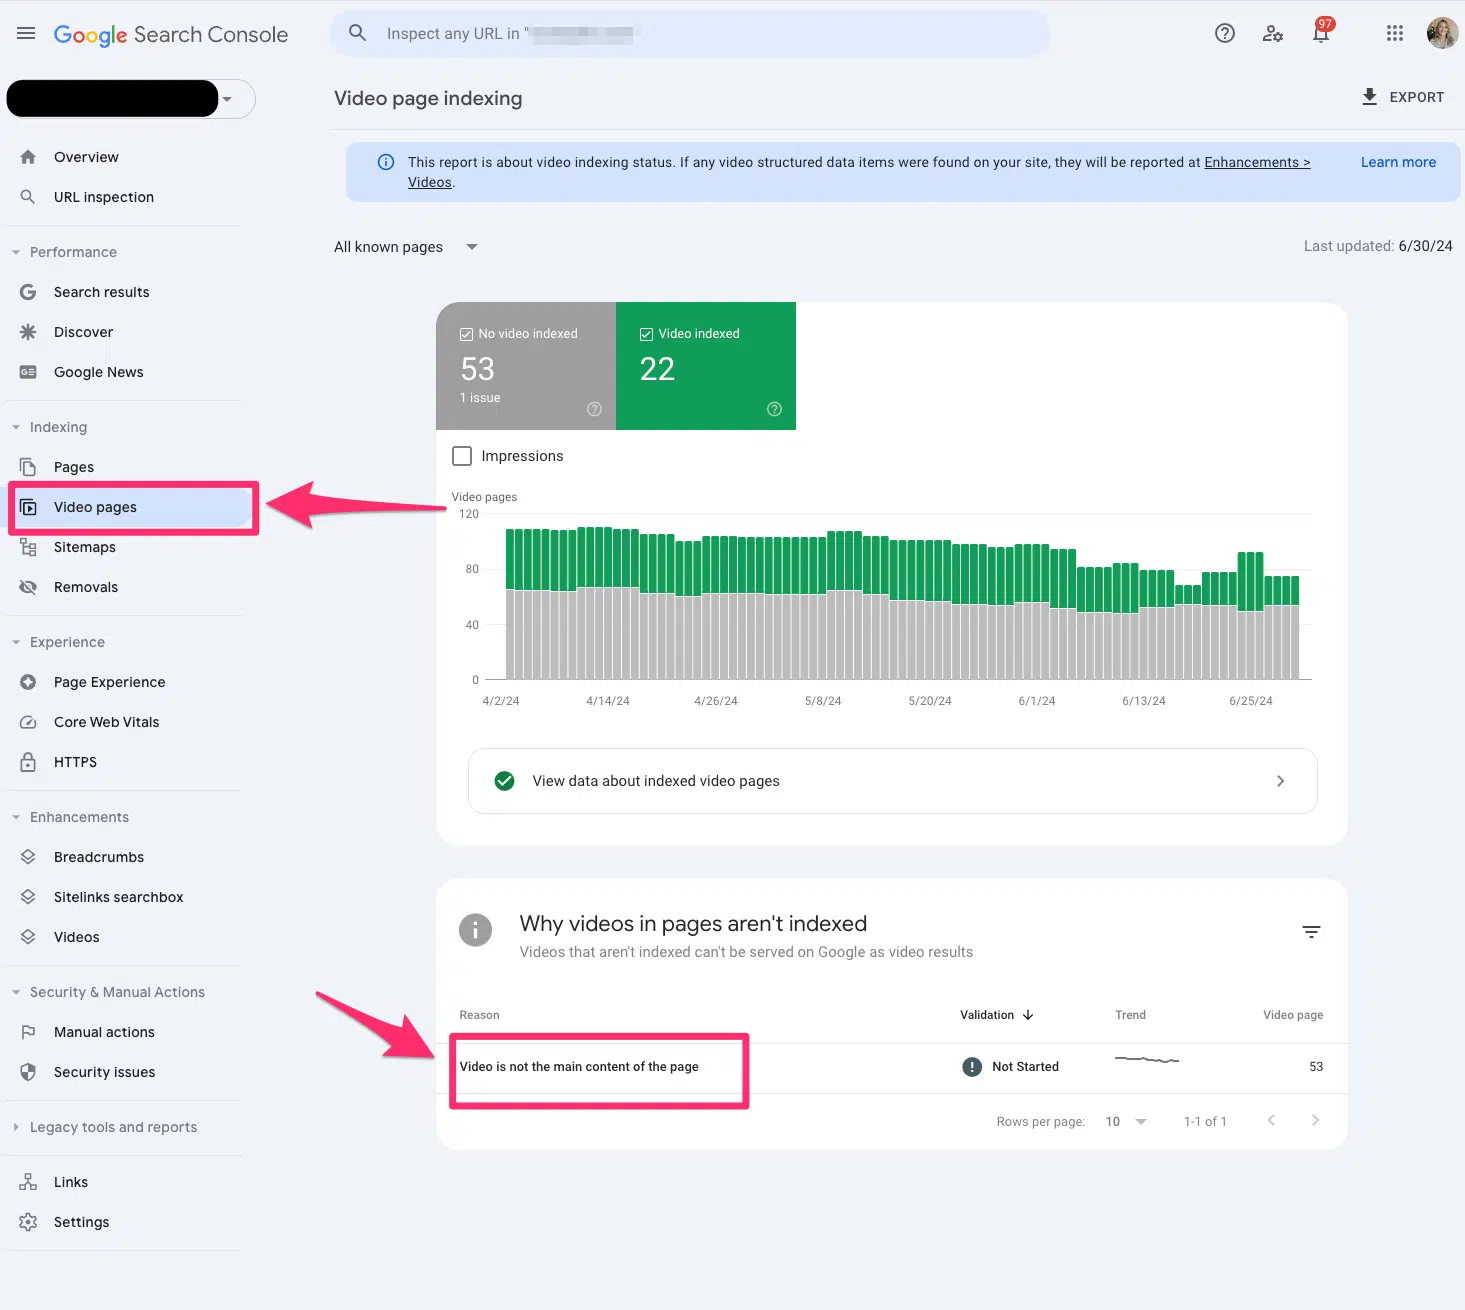
Video pages
The video indexing report displays how many pages on your website are indexed with video content somewhere on the page.
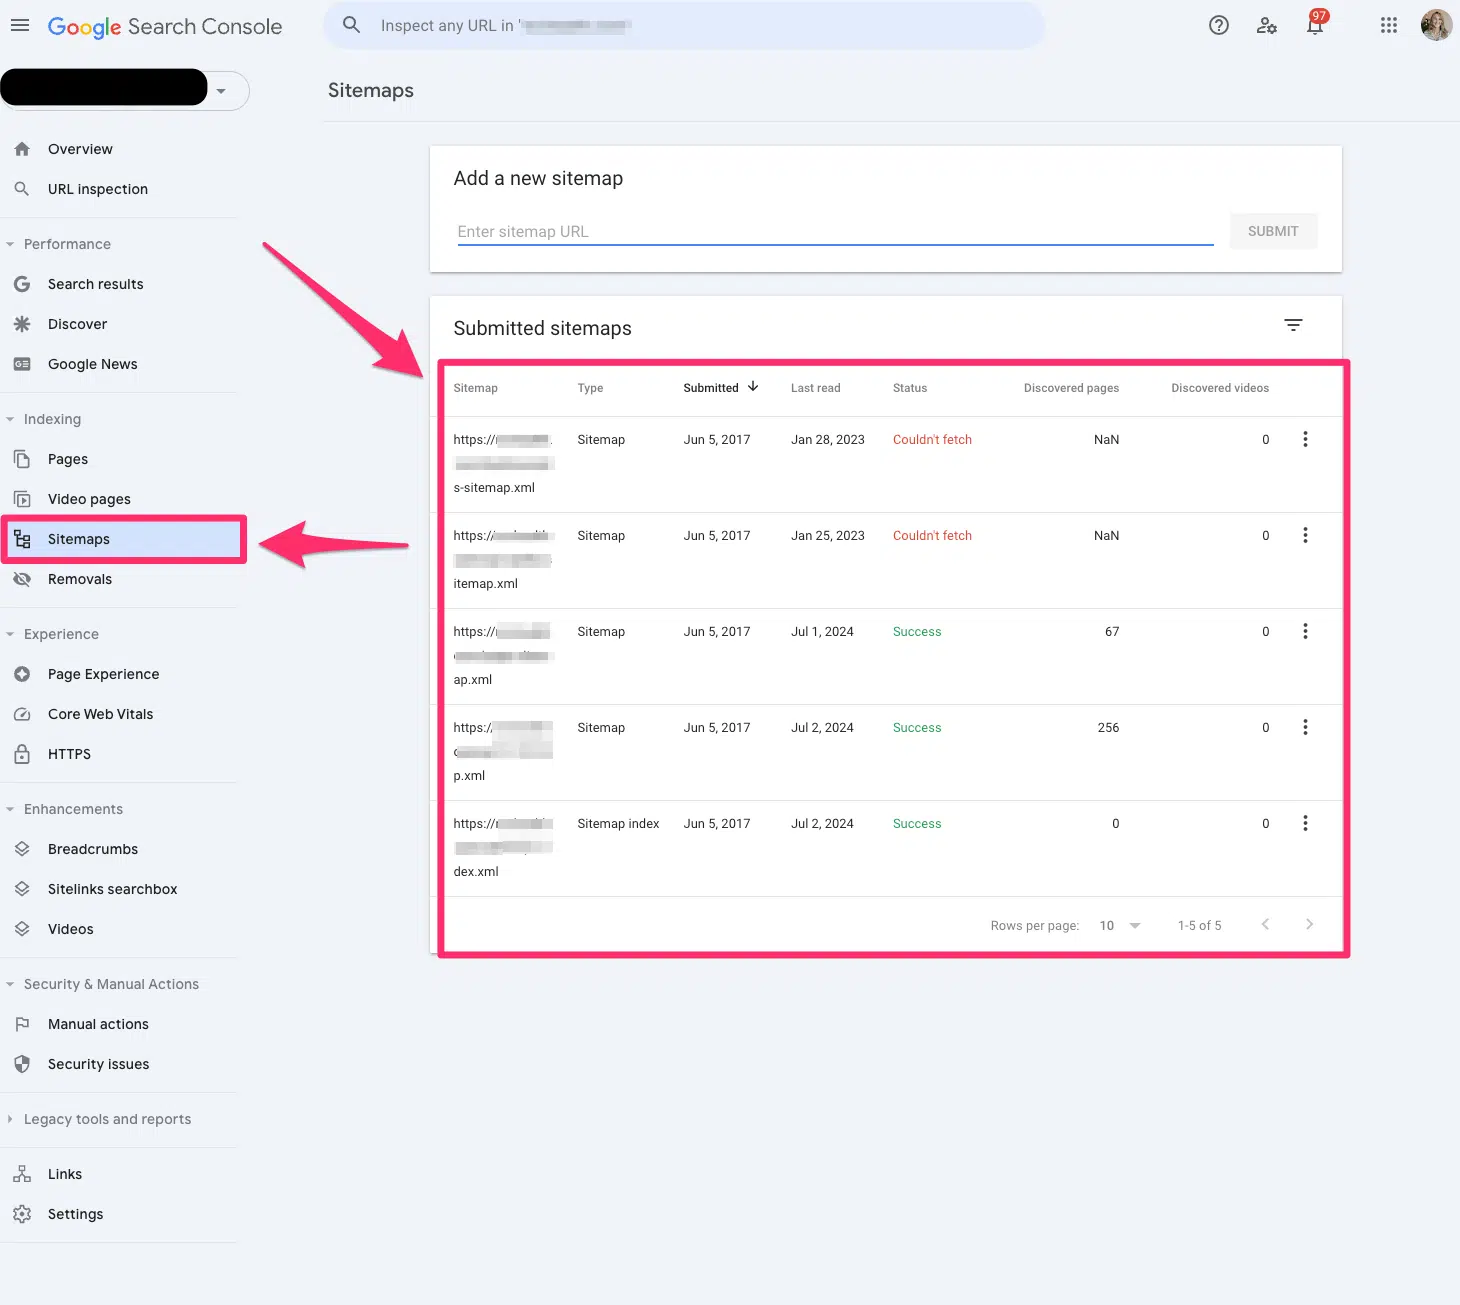
Sitemaps
The sitemap report allows you to submit all your XML sitemaps to Google Search Console. Ideally, you have at least one XML sitemap to submit.
You’ll have to submit all your XML sitemaps if you have video, image, or language-specific XML sitemaps.
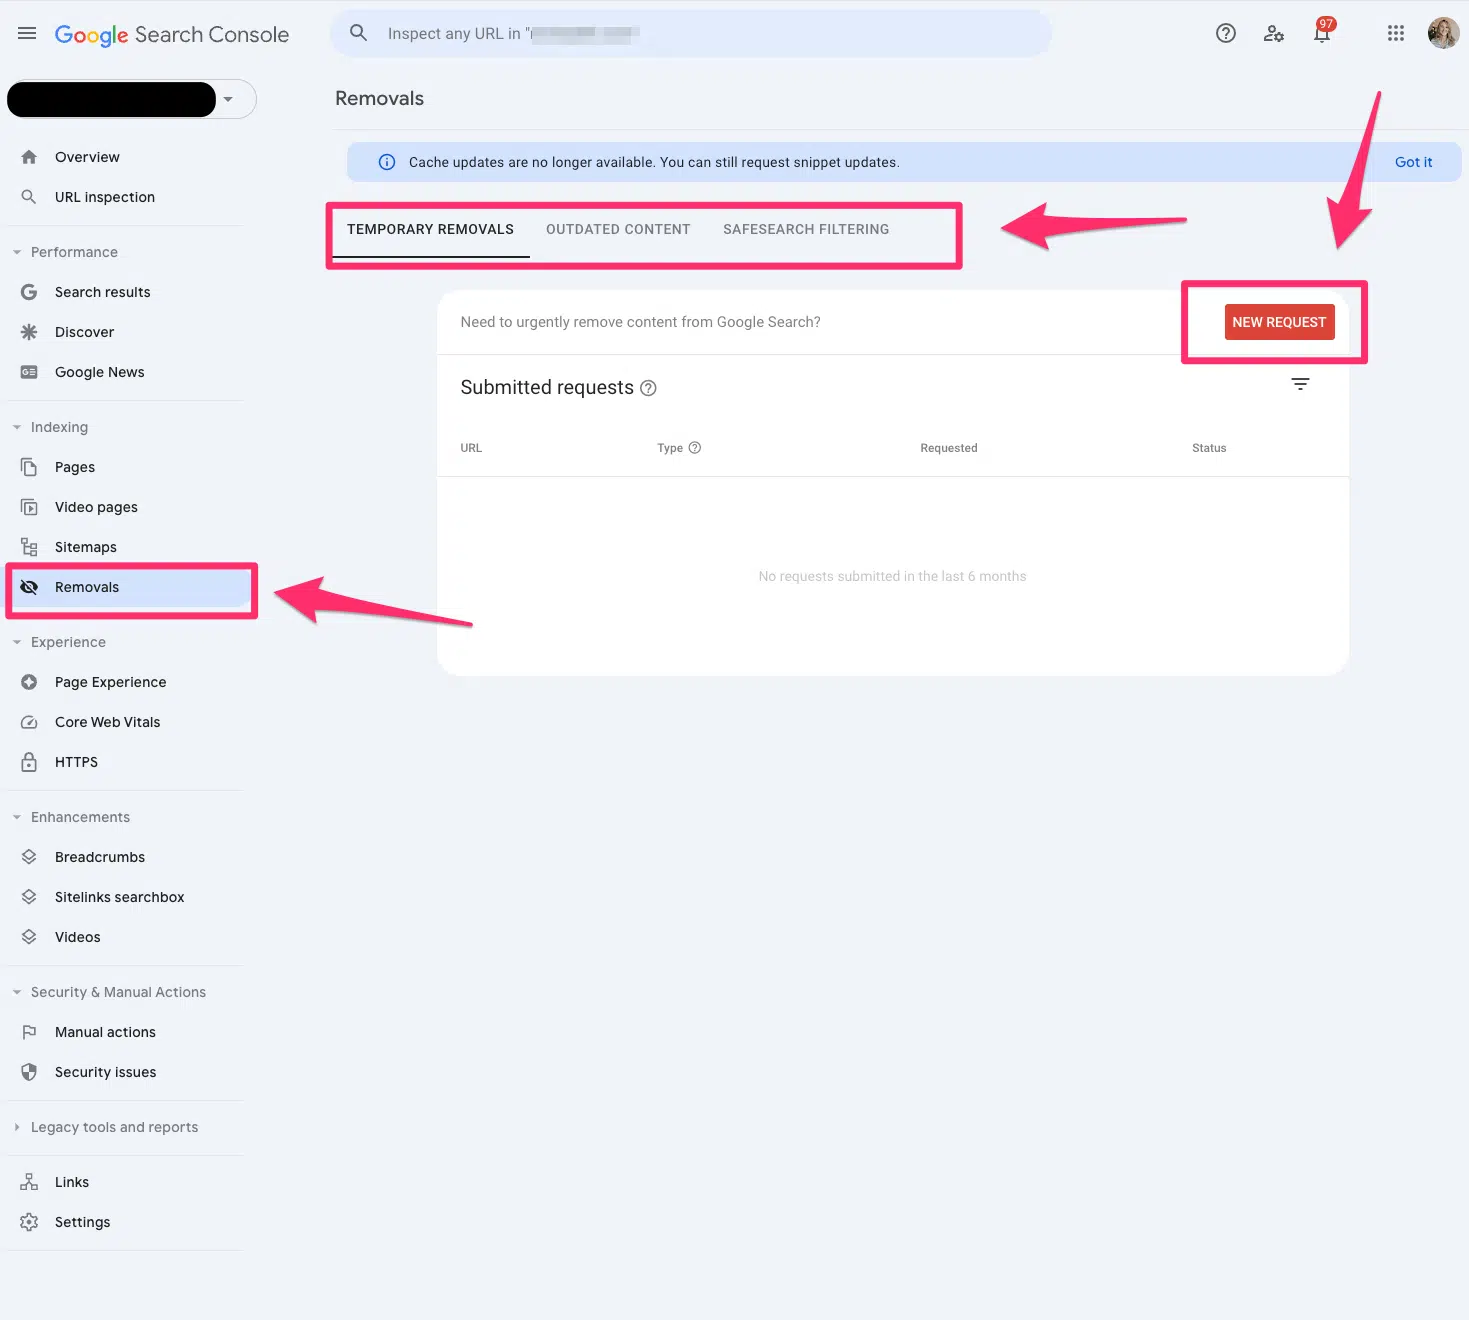
Removals
The removals tool in Google Search Console allows you to block pages from Google temporarily.
Remember, these must be pages that you own on your website. You cannot submit pages you do not own.
This is the fastest way to remove a page from your website. However, I recommend working on a long-term solution if you want this web page permanently removed.
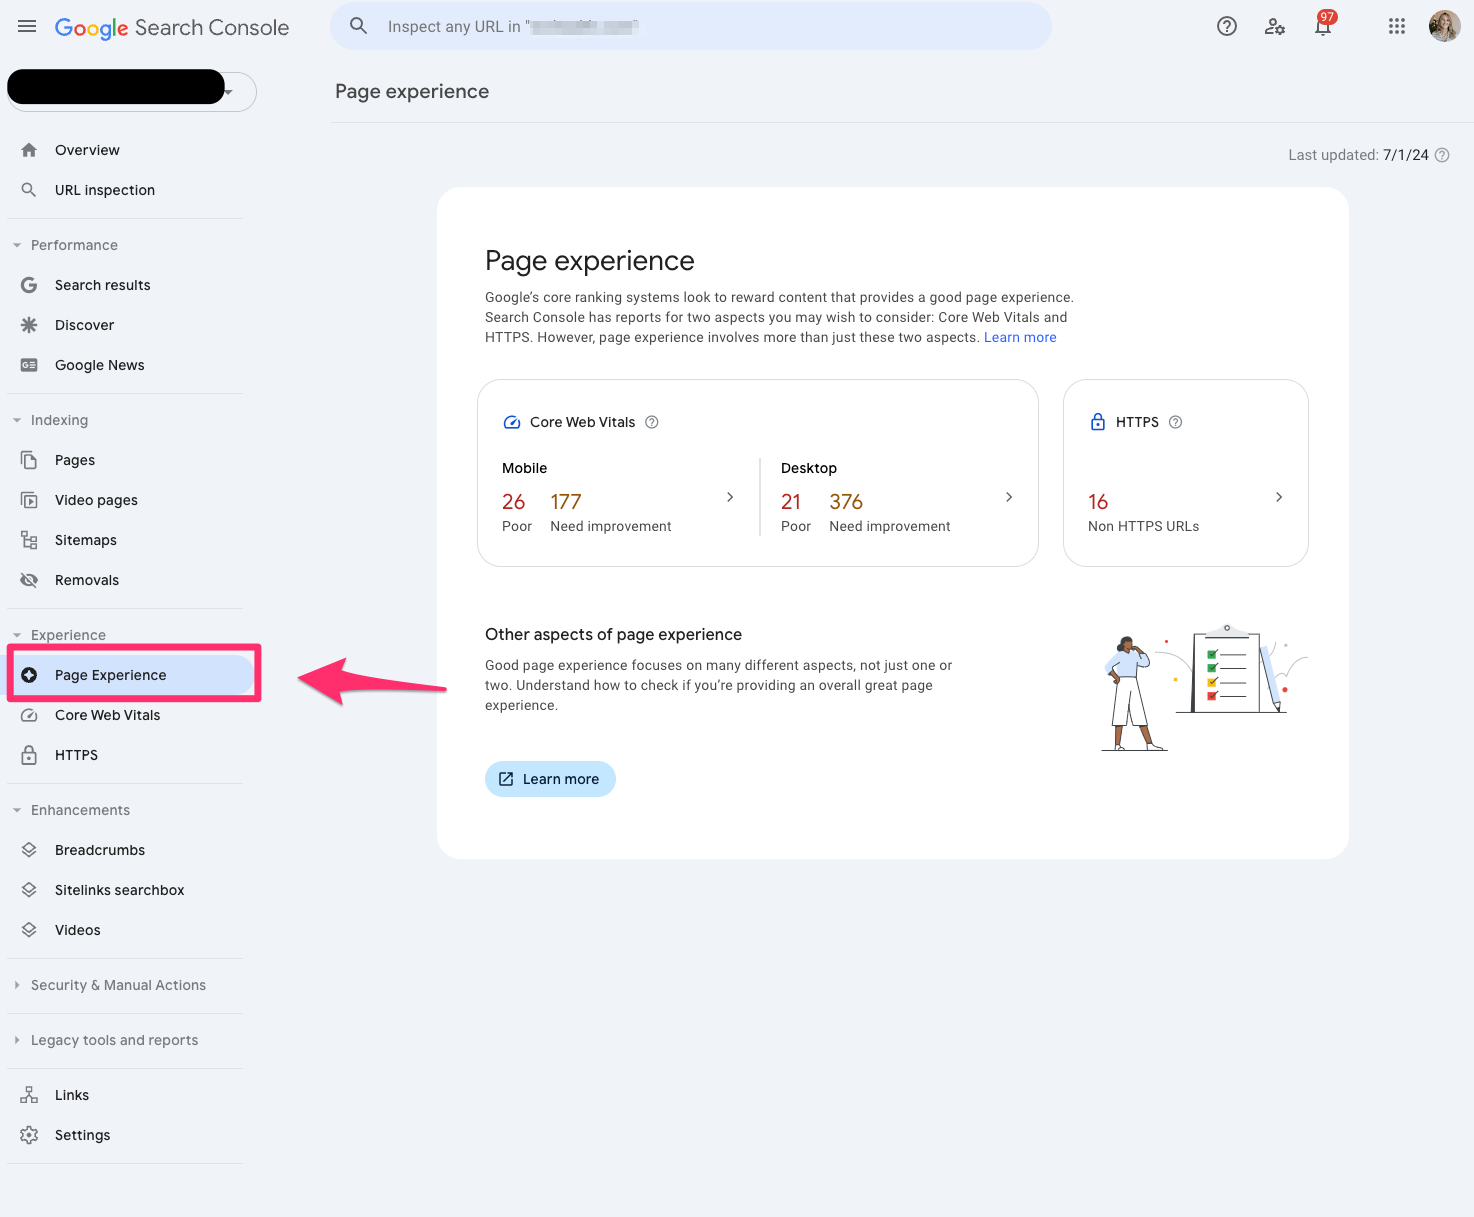
Page Experience
The Page Experience report in Google Search Console provides a glimpse of how user experience is on your website.
It’s important to remember this is based on URL level.
The page experience report includes Core Web Vitals and HTTPS usage.
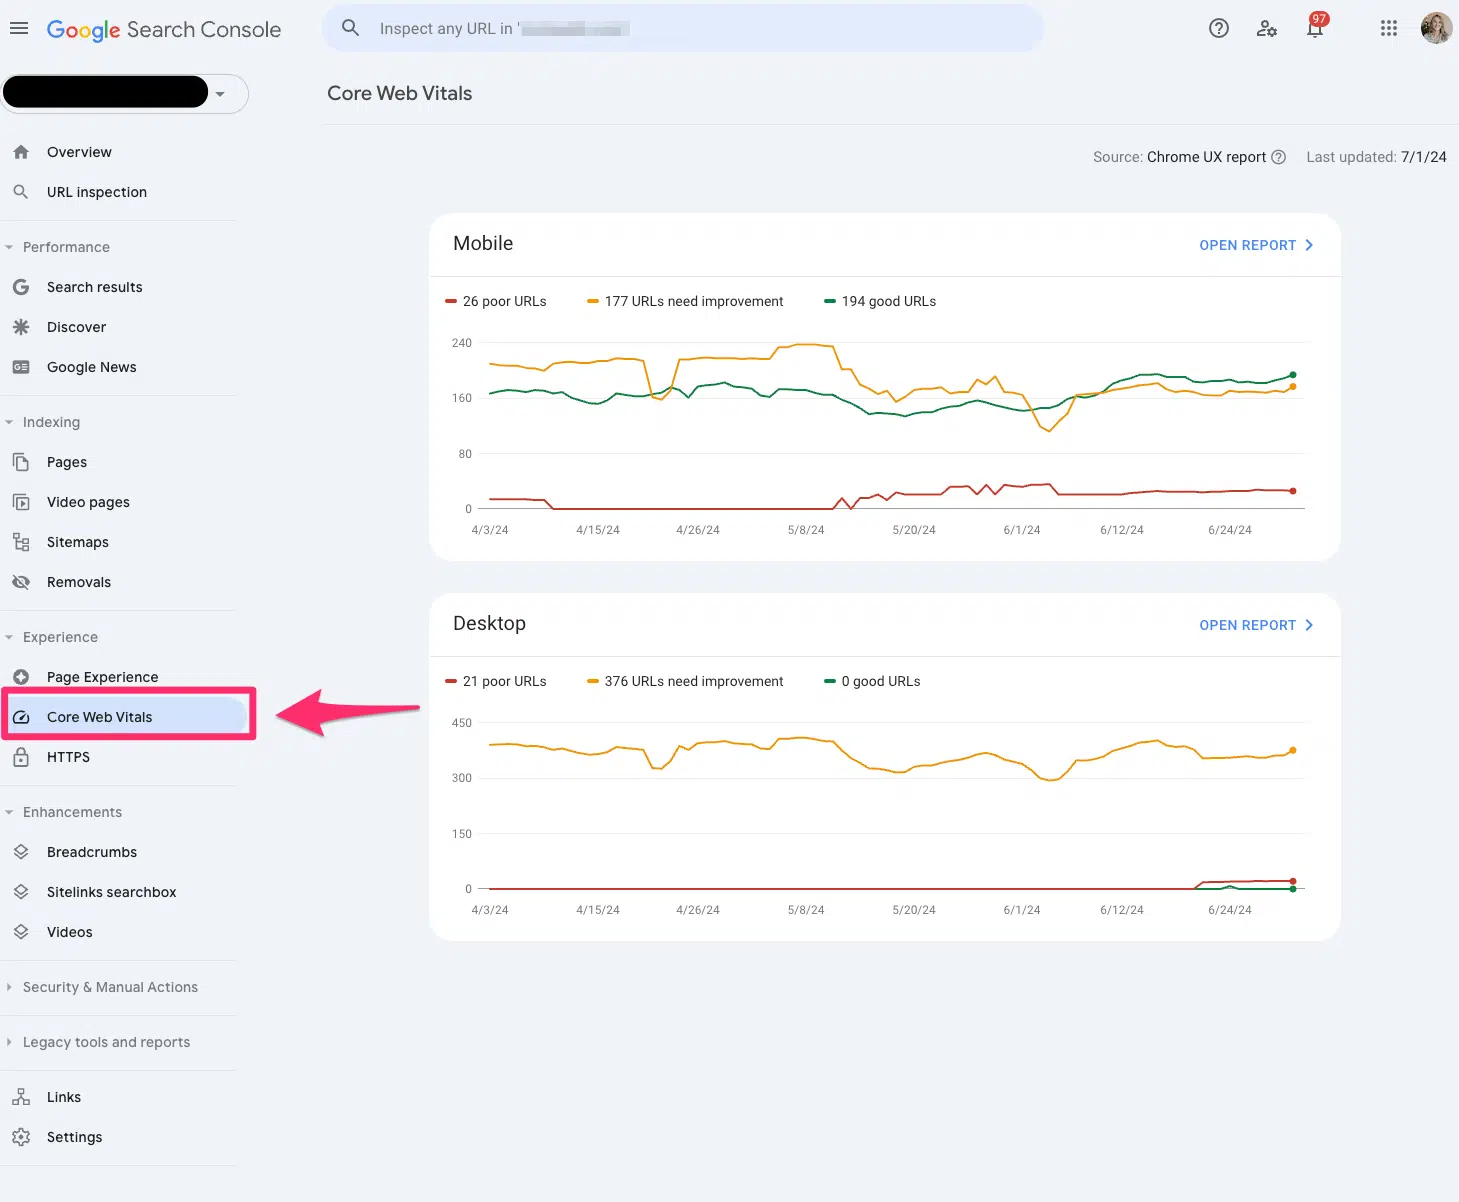
Core Web Vitals
The Core Web Vitals report uses real-world data to tell you how your pages perform.
Again, this is based on a URL level.
The report is grouped into mobile and desktop with segments of poor, needs improvement and good.
The report is based on LCP, INP and CLS user data.
Only indexed pages will be included in the Core Web Vitals report.
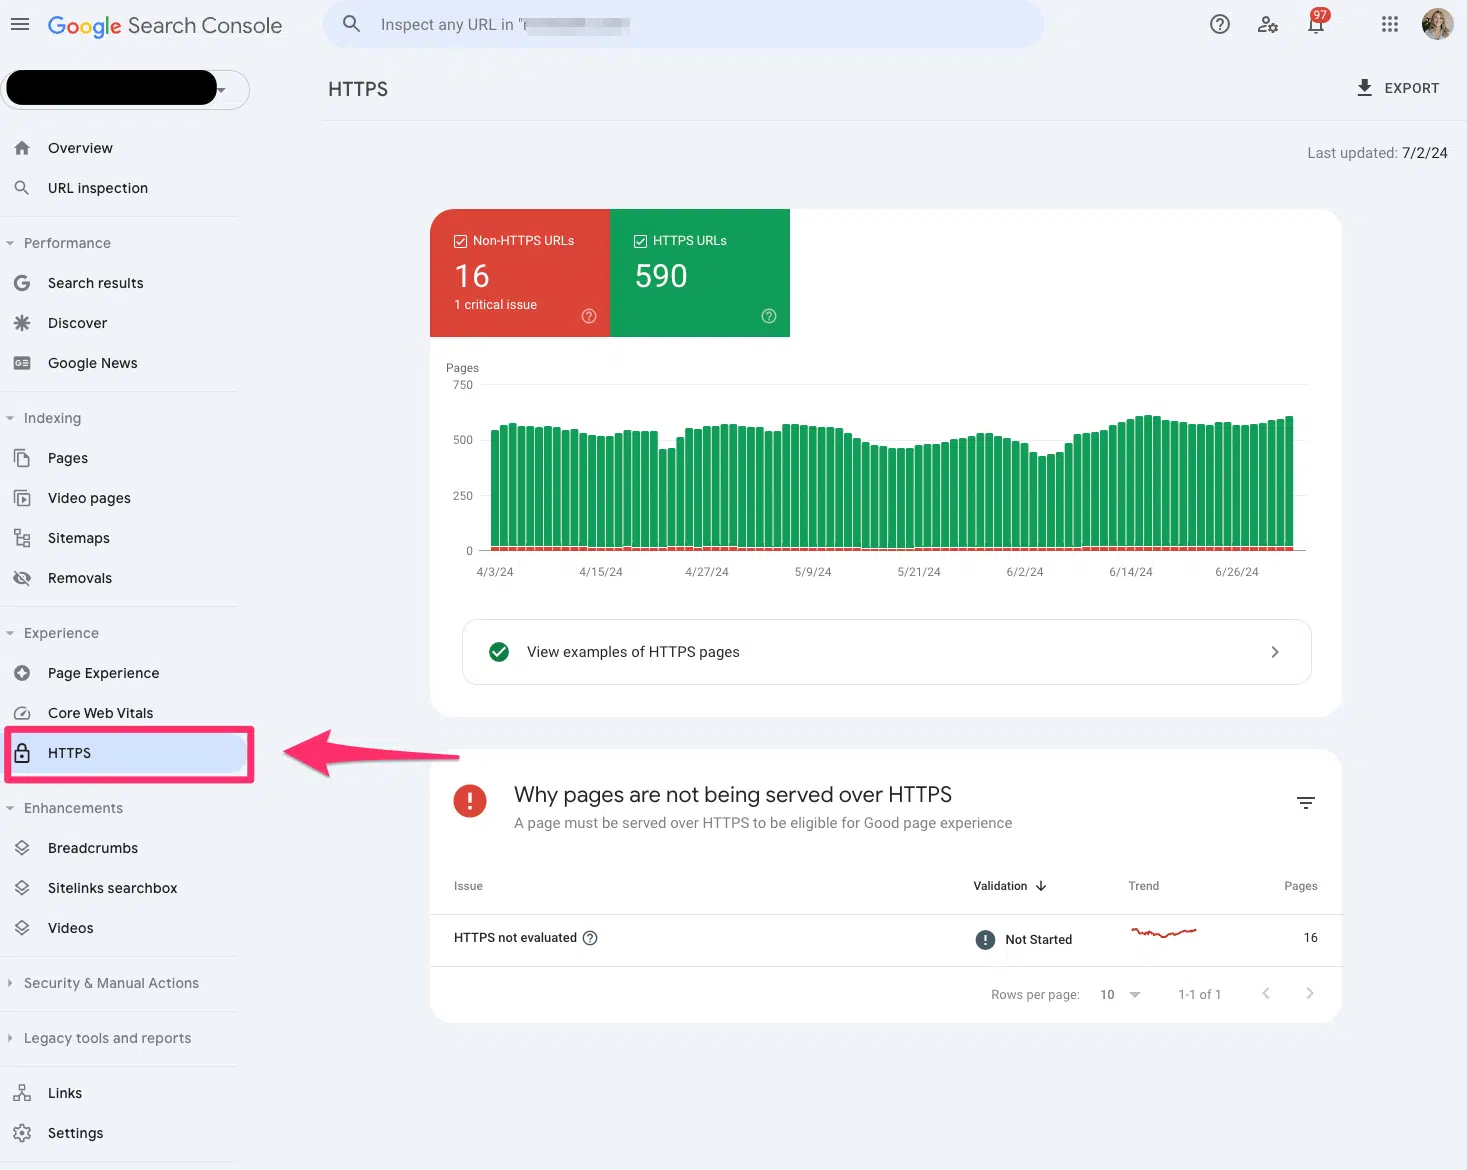
HTTPS
The HTTPS report tells you how many indexed pages on your website are HTTP or HTTPS.
If you notice any HTTP pages on your website, you should convert them to HTTPS. Google indexes the HTTPS version to protect searchers’ security and privacy.
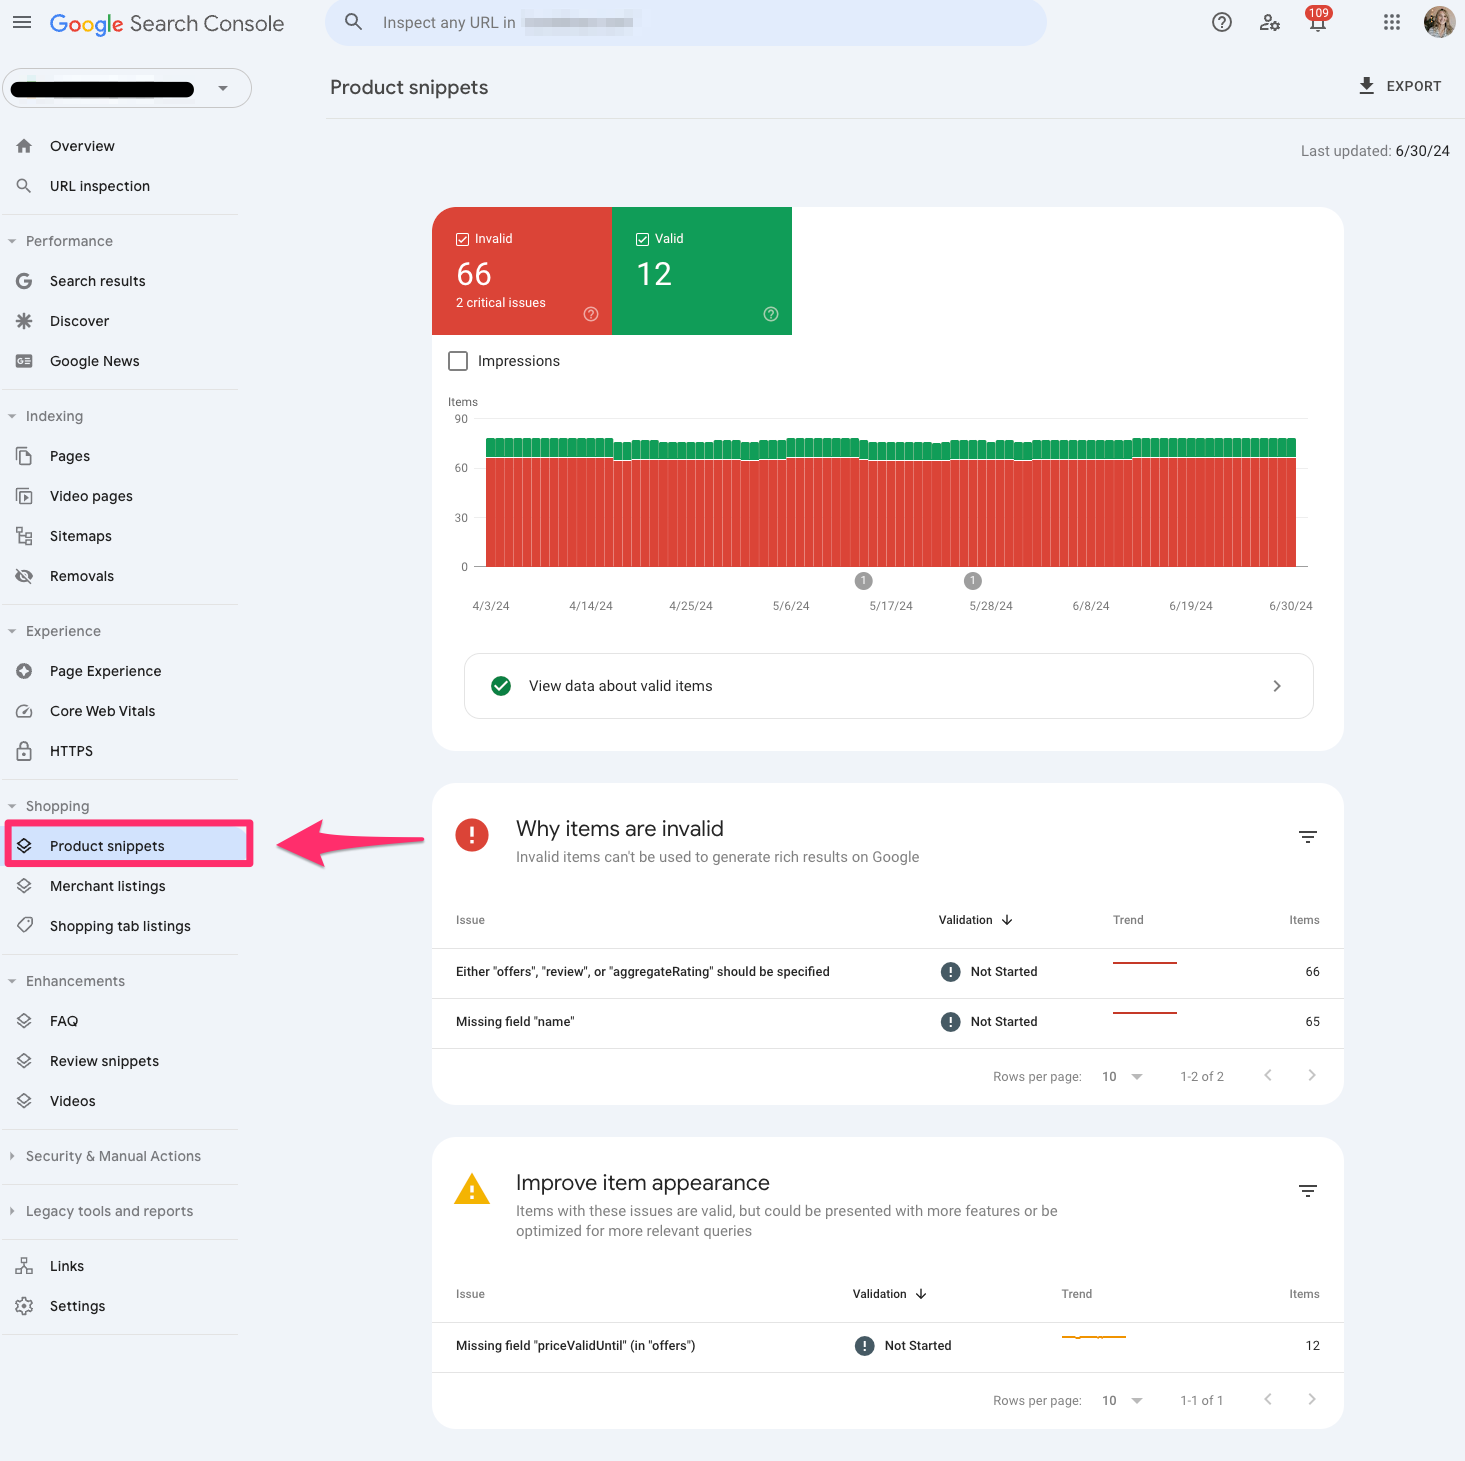
Product snippets
Product snippets are part of the structured data reporting in Google Search Console that showcases which products have product markup on the page.
Currently, Google only supports product snippets for pages with one product.
Be aware of Google’s algorithm updates; there can be changes in impressions and clicks for product snippets.
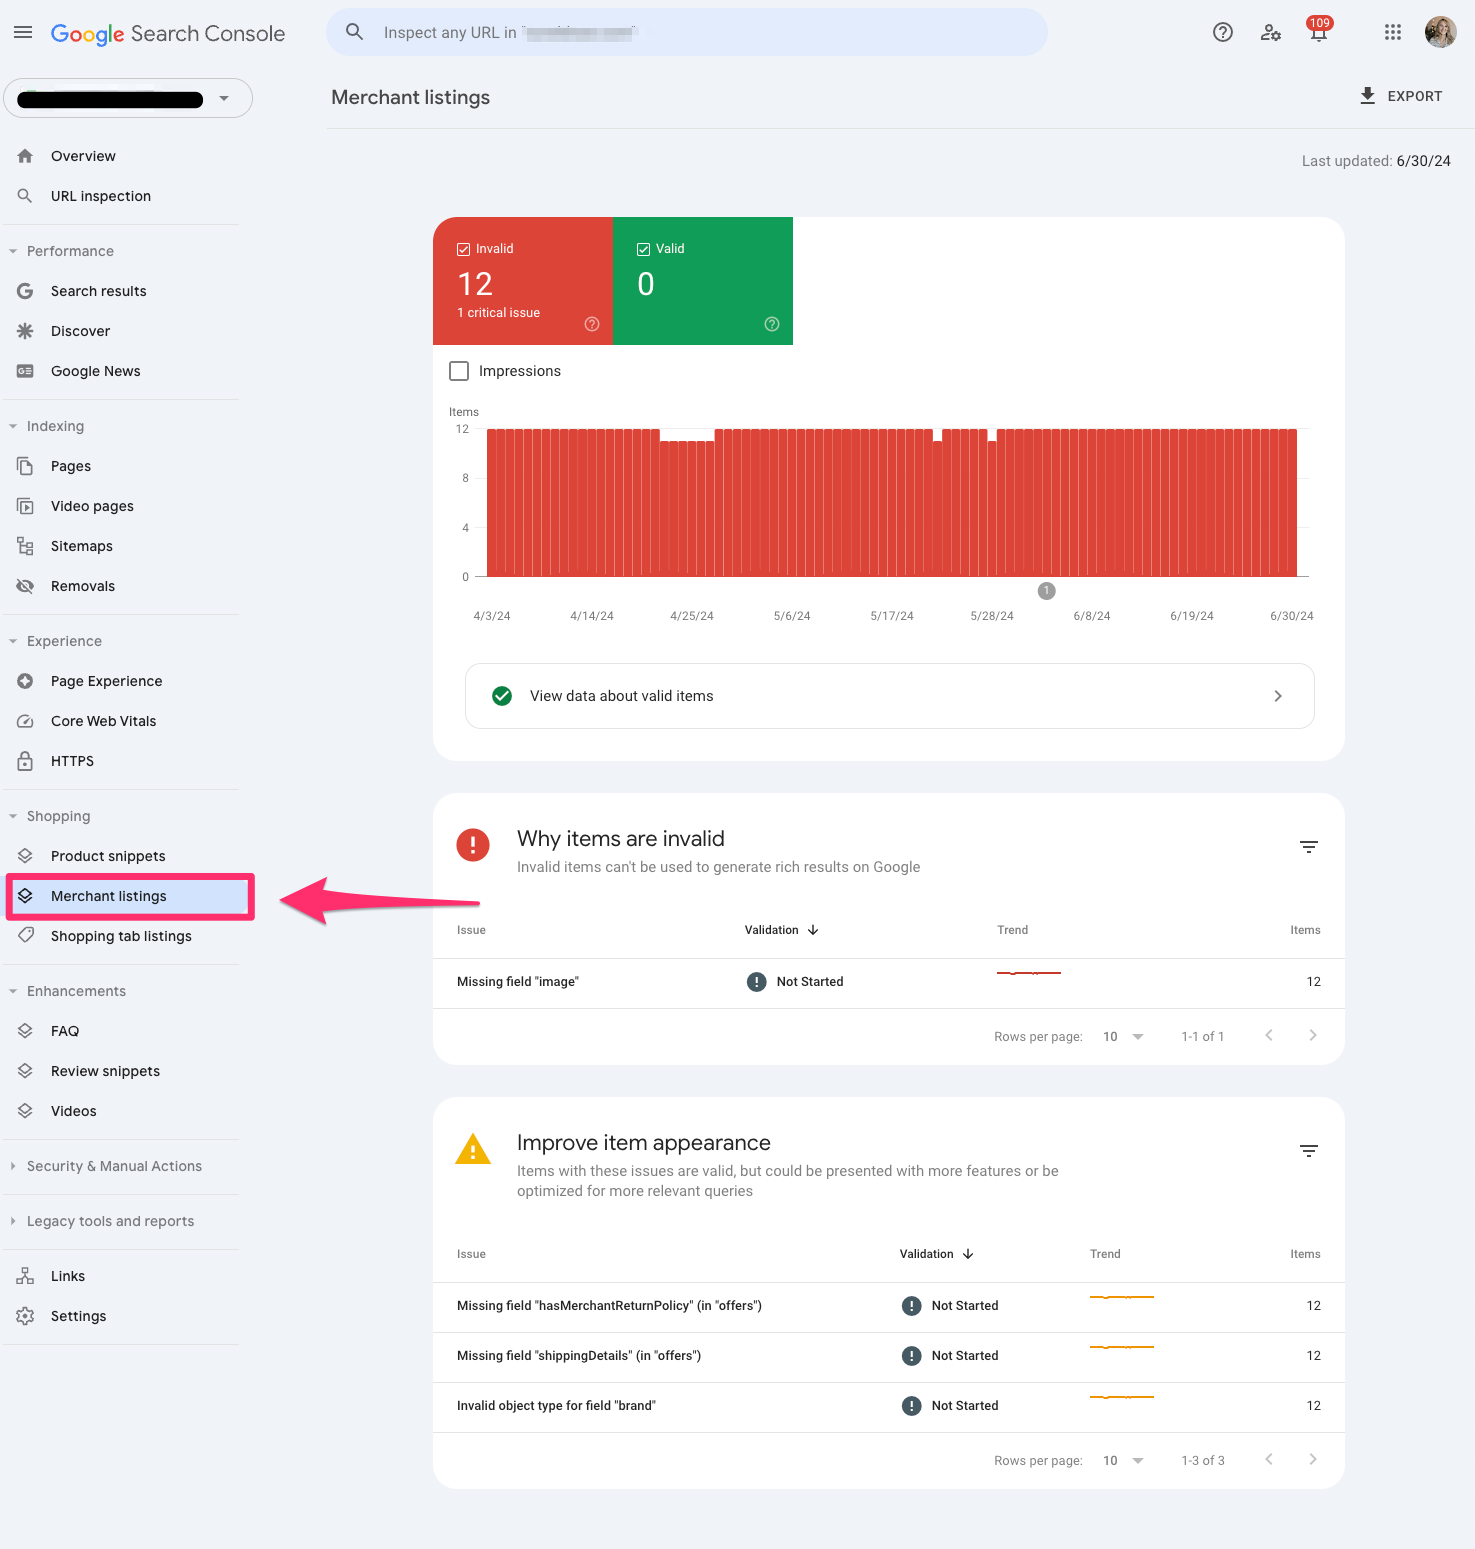
Merchant snippets
Merchant snippets are also part of the rich result report in Google Search Console and serve as extensions of your Product snippet.
Merchant snippets are like getting a golden ticket. It provides more enhanced features in the SERPs like carousels or knowledge panels.
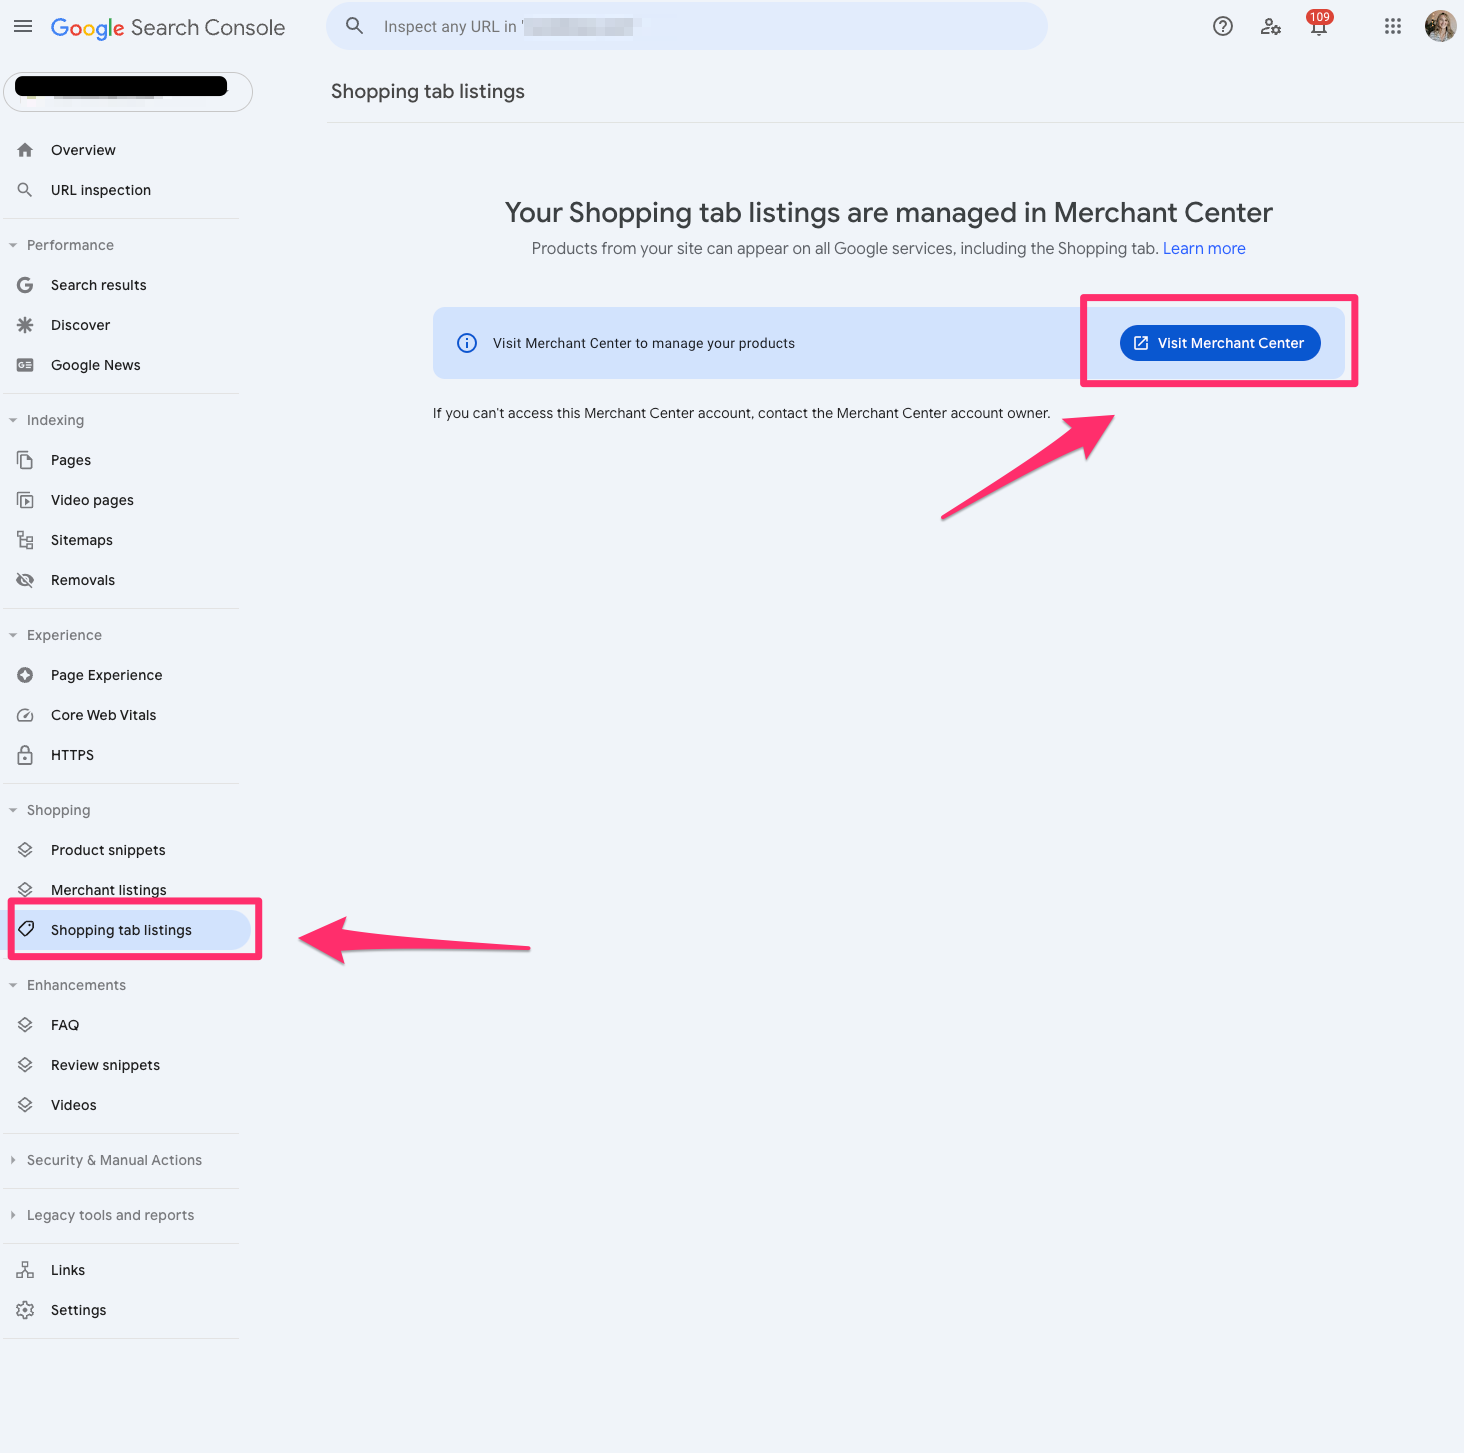
Shopping tab listings
Shopping tab listings are also part of the rish result reports in Google Search Console and showcase the pages listed in the Shopping tab in Google search results.
If you’re an ecommerce marketer, you’ll want to live inside this report.
Pro tip: If you don’t see this information in Google Search Console, make sure your website’s structured data fits within the Merchant listing structured data requests.
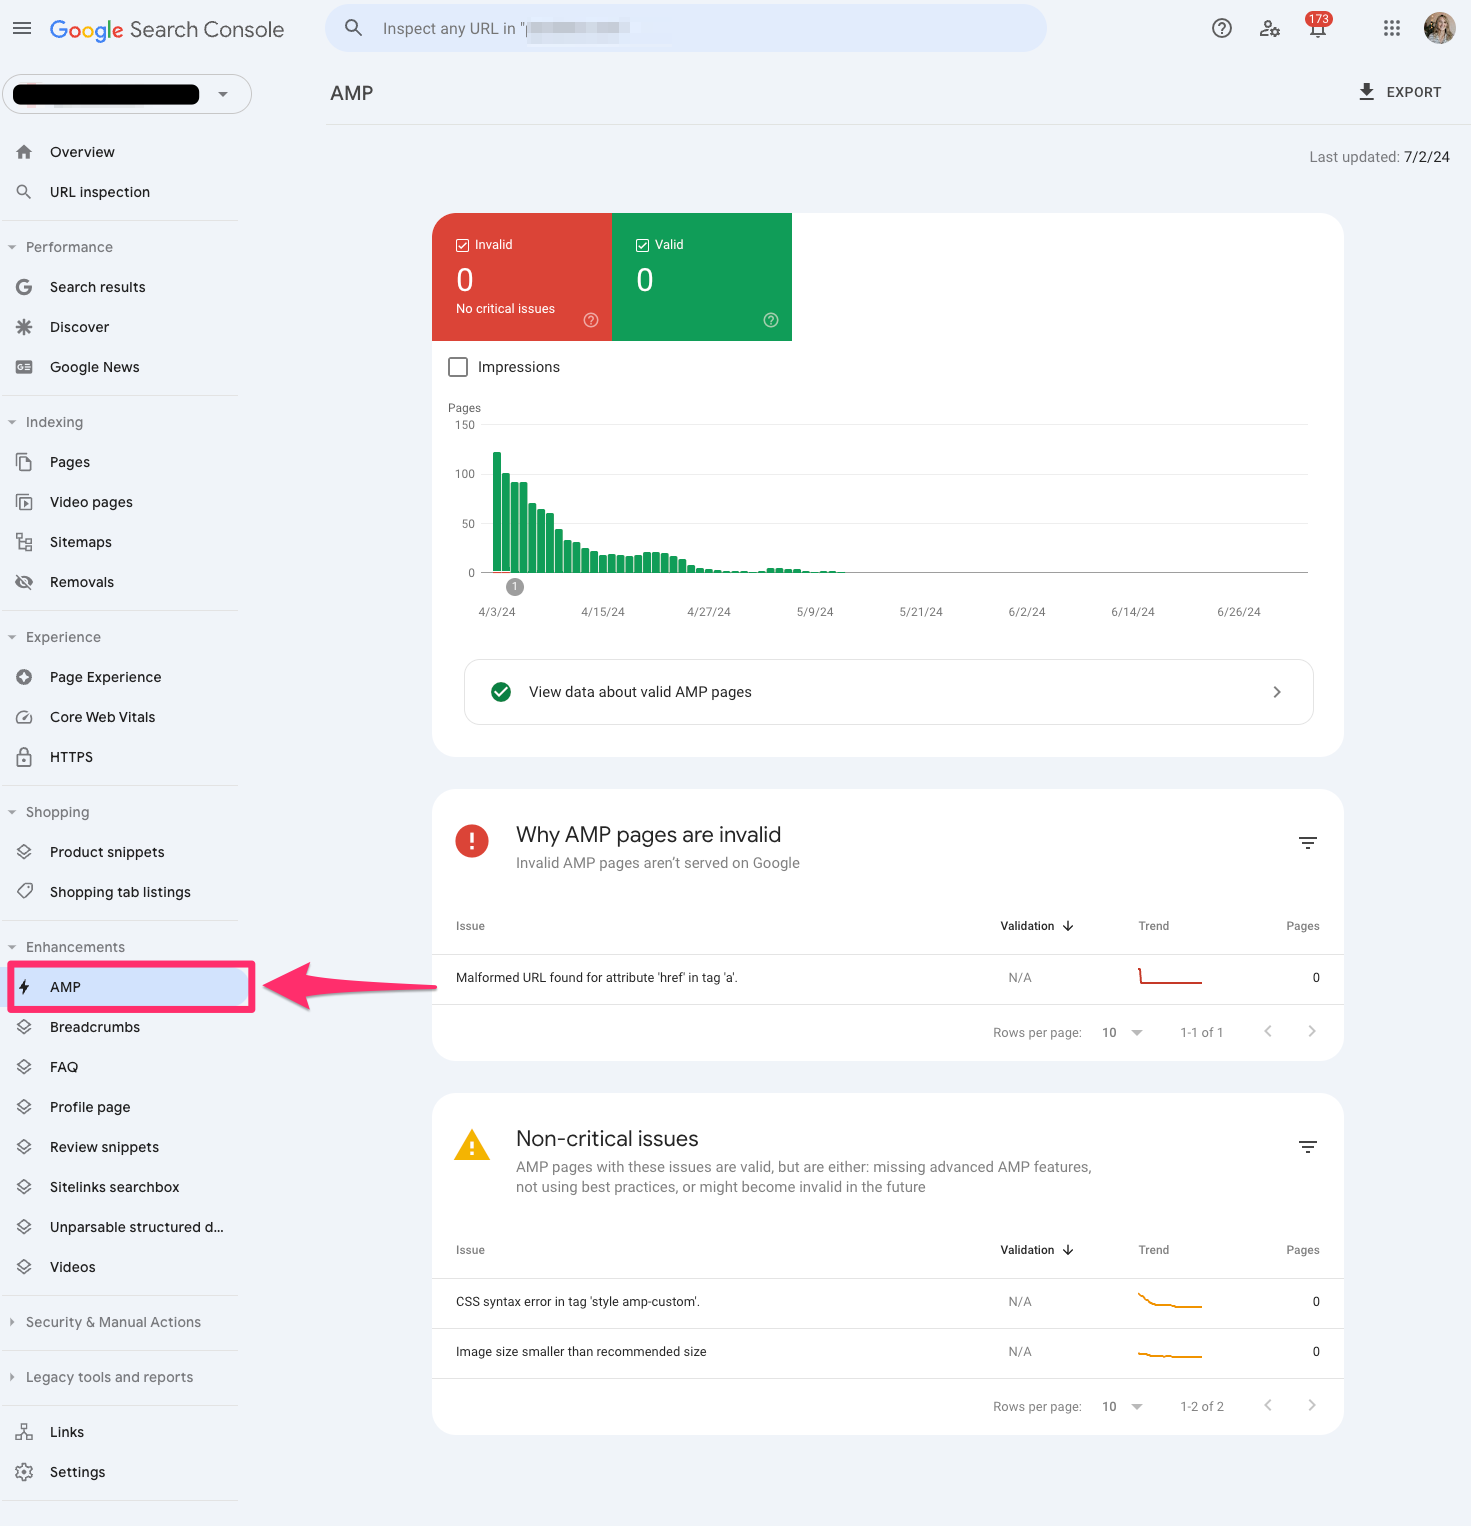
AMP
The AMP report in Google Search Console shows all the AMP pages on your website and potential issues you may need to troubleshoot.
If AMP is a big part of your SEO strategy, you’ll want to ensure you reach zero in the critical errors section of the report so Google can detect your AMP pages.
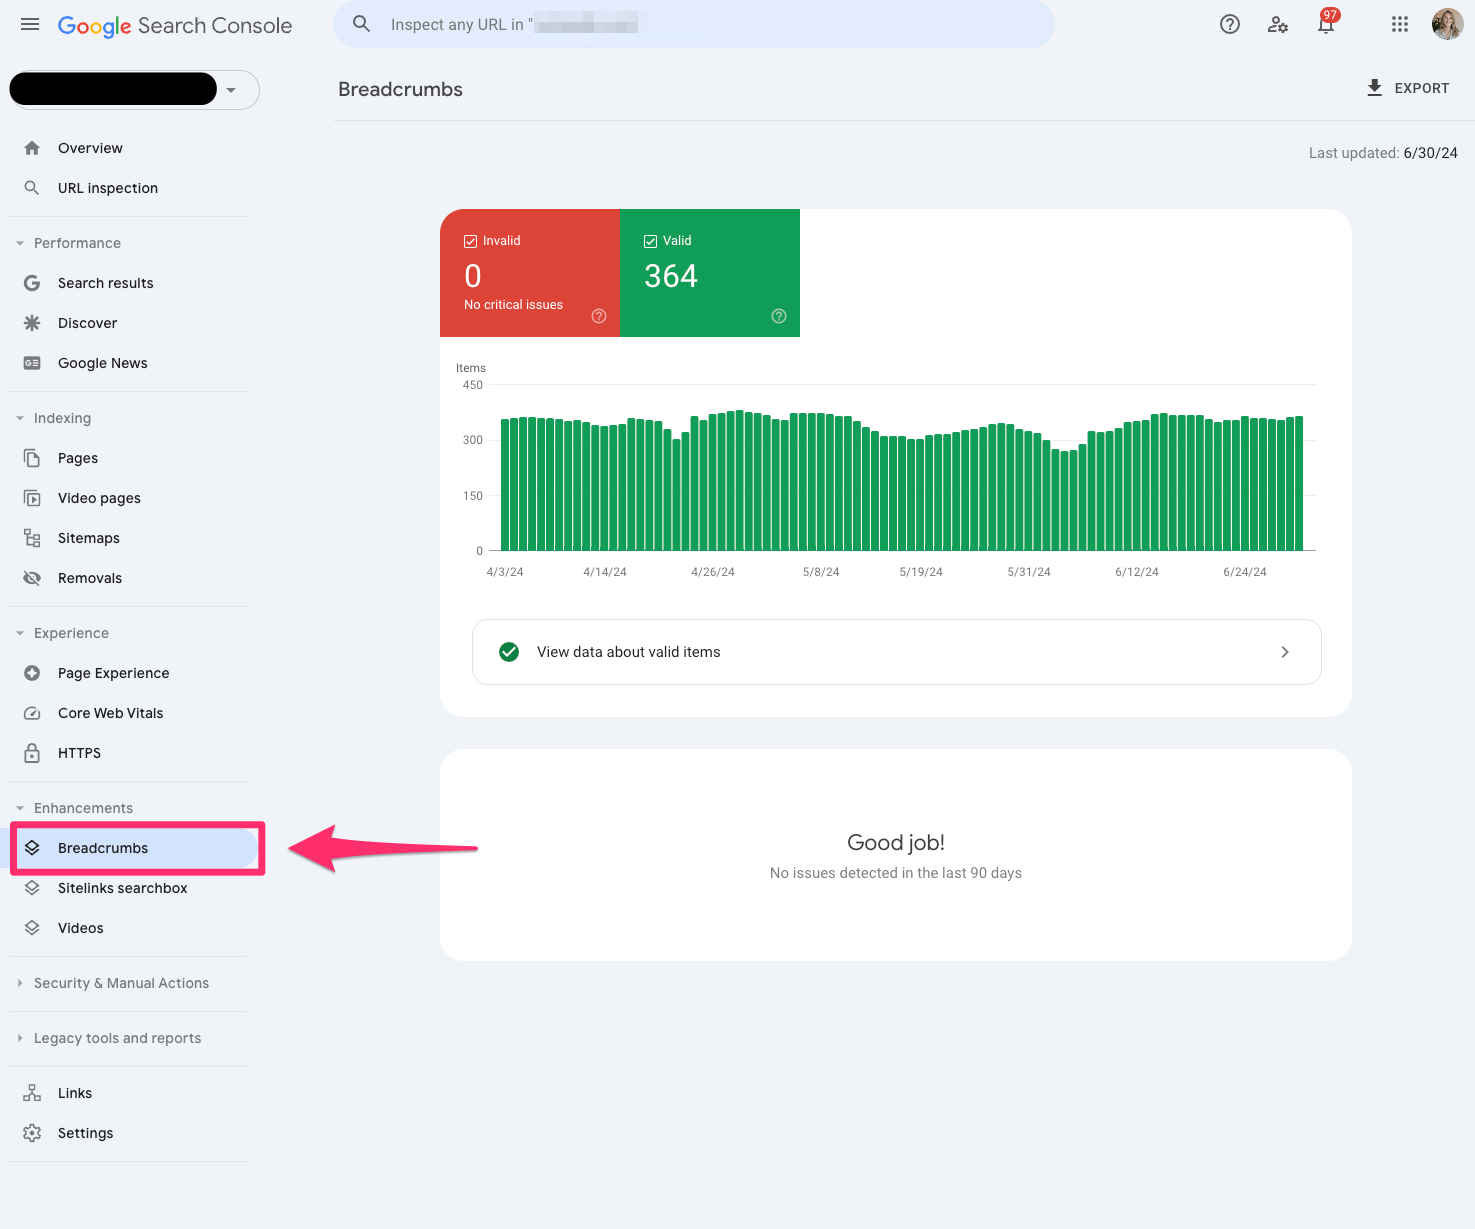
Breadcrumbs
The breadcrumbs report is also part of the rich result report in Google Search Console, which tells you if your breadcrumb structured data is correct and readable by Google.
Breadcrumbs are essential to maintain a healthy site architecture and user experience. If you see any errors in the breadcrumbs, I recommend prioritizing this quickly.
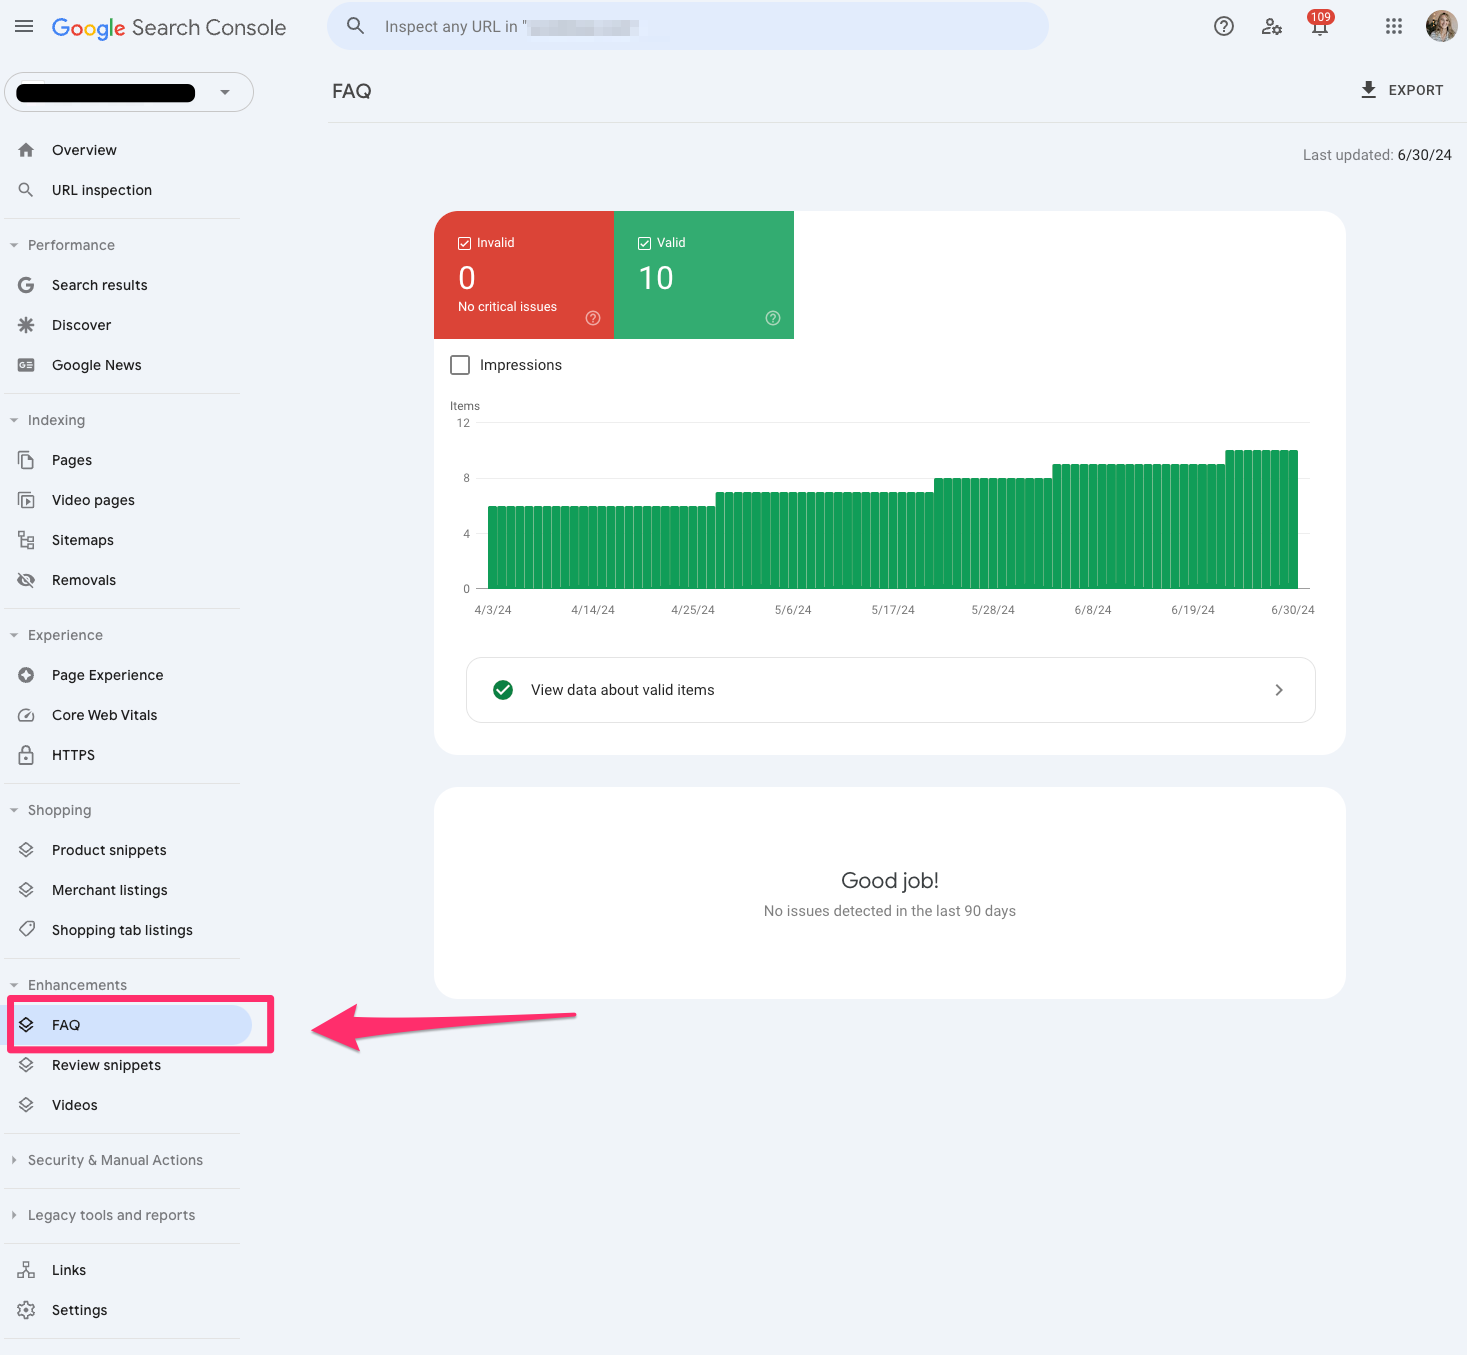
FAQ
The FAQ report is also part of Google Search Console’s rich results report, which shares insights into which pages received the FAQ snippet.
However, with Google’s changes to visibility of HowTo and FAQ rich results, you may see this fluctuate quite a bit.
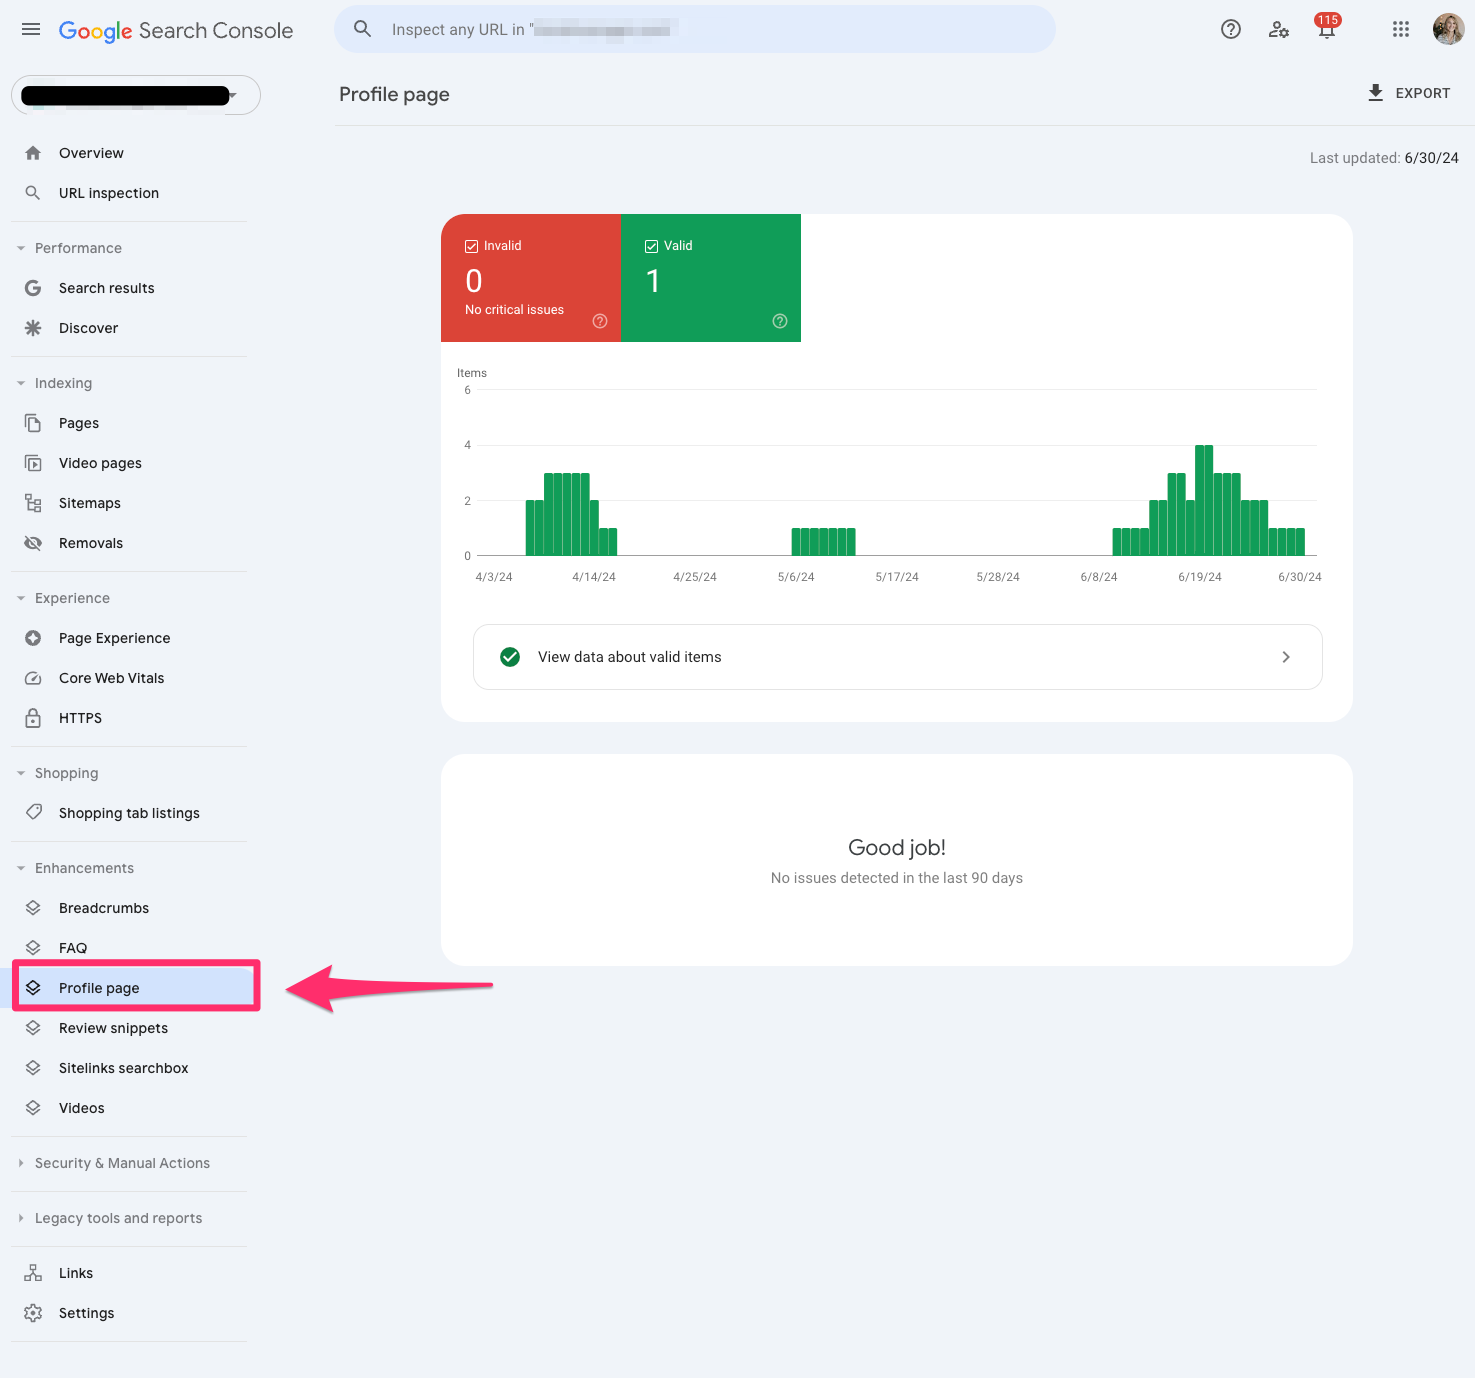
Profile page
The Profile page report reflects which pages are getting the profile page markup. You’ll want to validate and clean up any makeup you may be missing because these offer interesting SERP features.
It’s almost like a card functionality similar to the recipes.
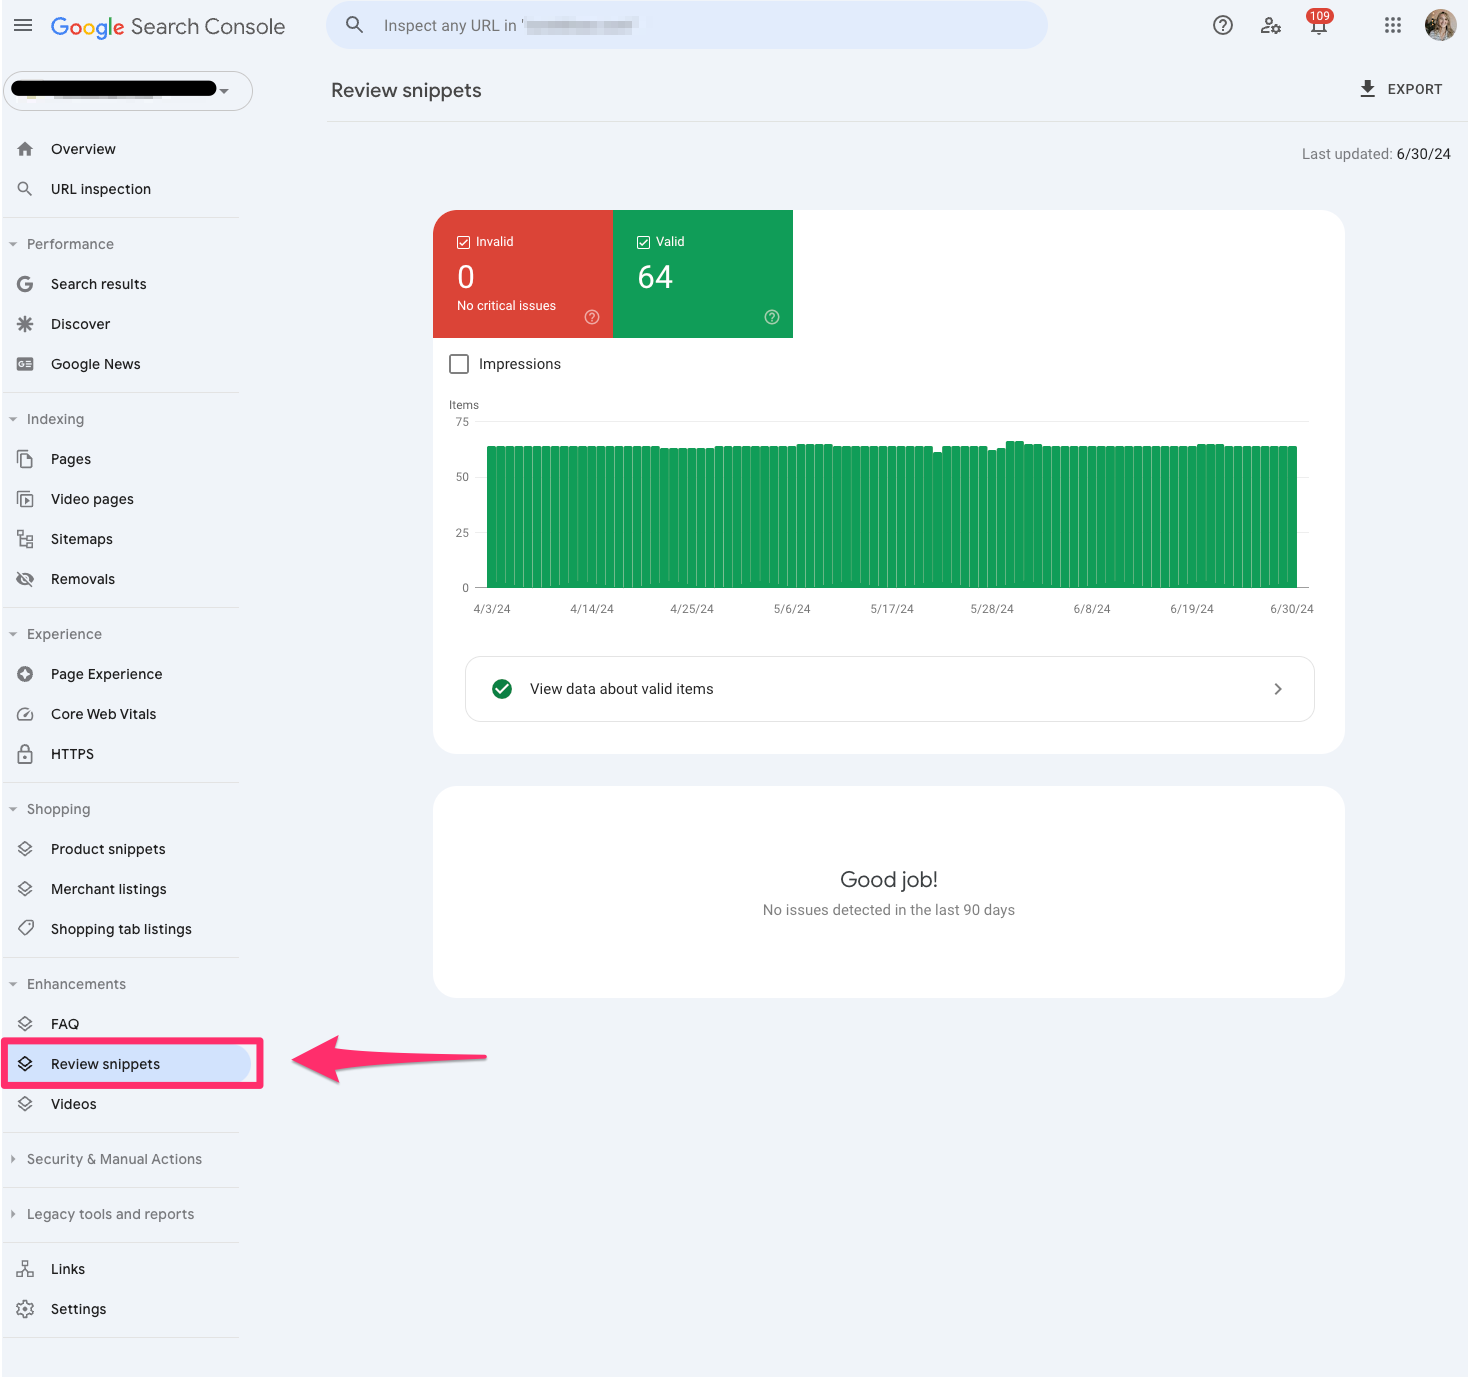
Review snippets
Review snippets showcase your validation of review markup on pages.
You should check that all your markup is valid. If you notice any errors, work on updating those specific pages.
With Google’s algorithm updates, I’ve seen significant fluctuations in review snippets. Always double-check if it’s a bug, algorithm update or a true markup error.
Sitelinks searchbox
The sitelinks searchbox is a feature of the rich result report in Google Search Console that tells us in more detail any errors you may have to your Sitelinks Searchbox markup.

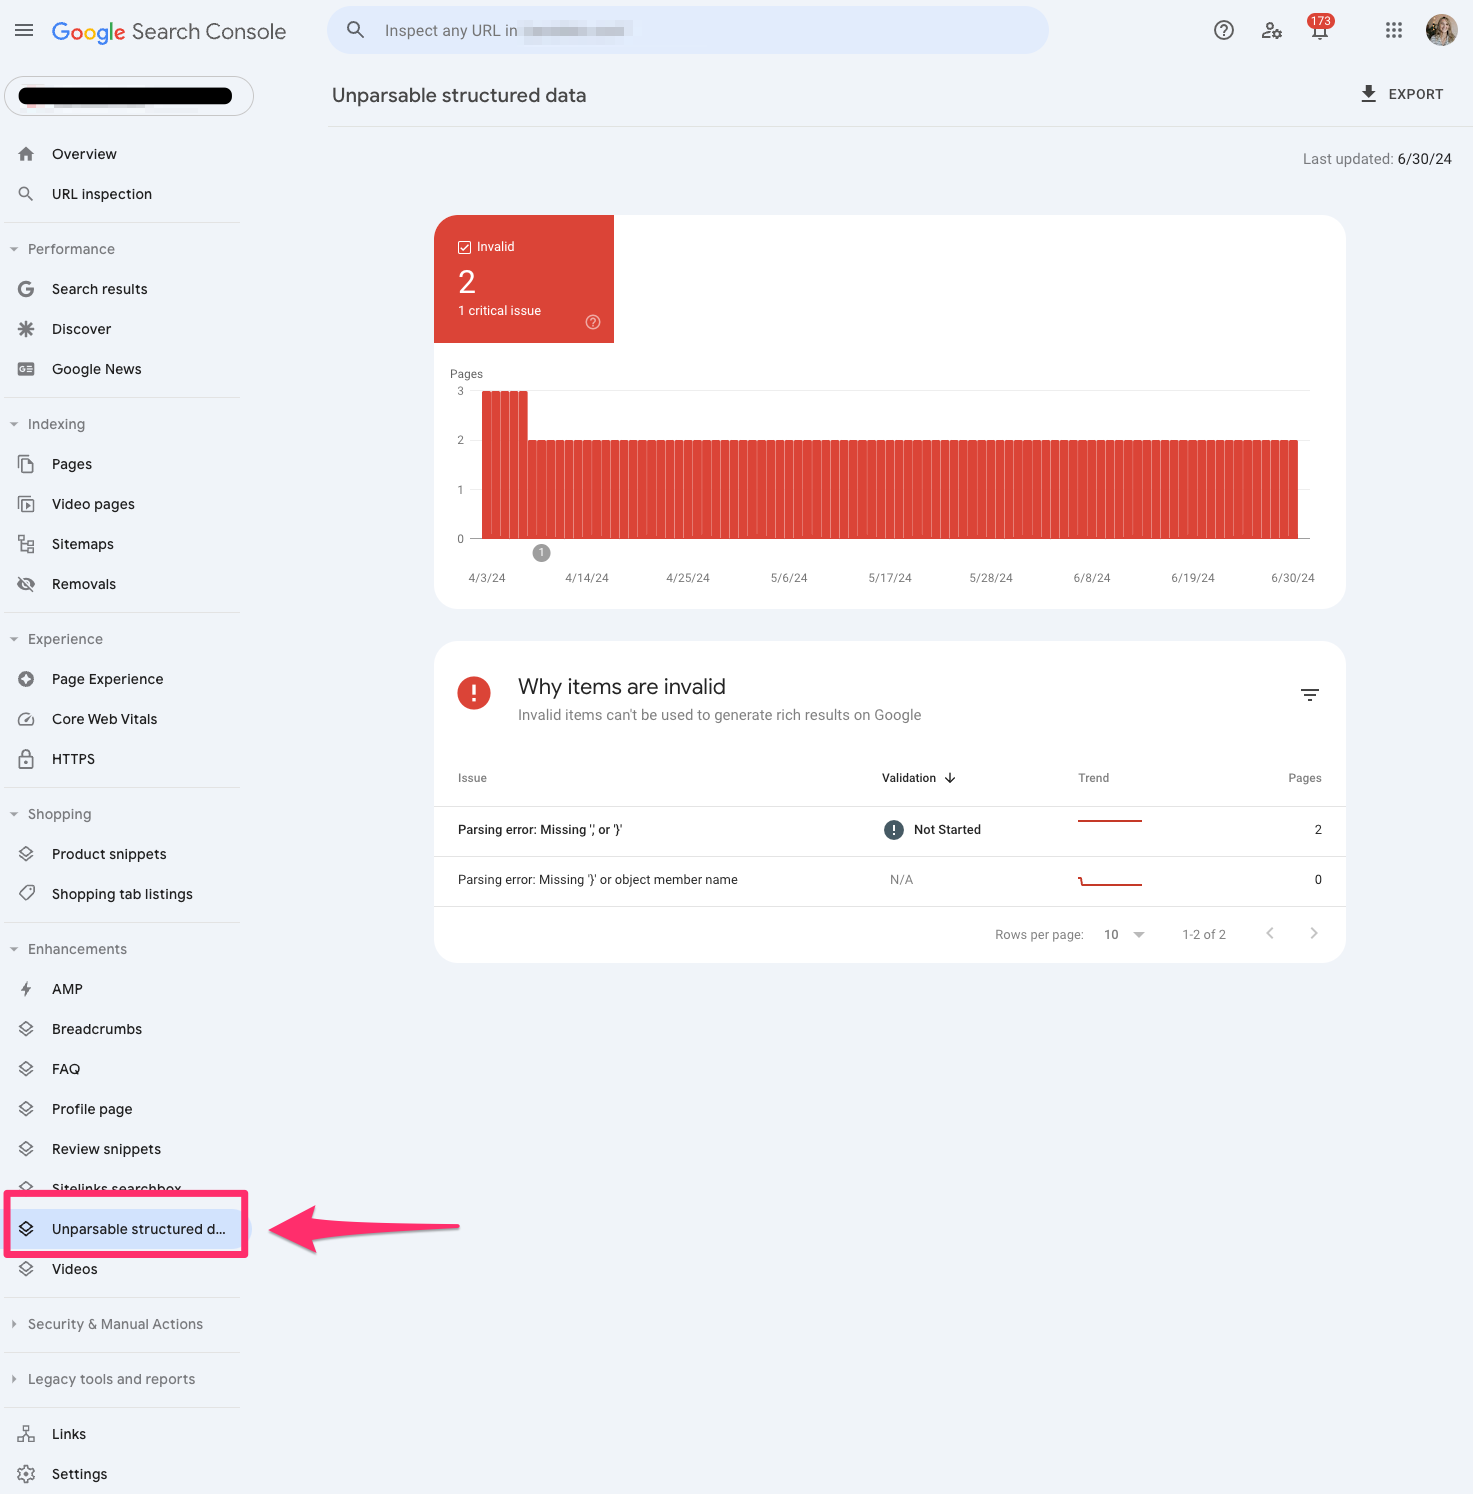
Unparsable structured data
The unparsable structured data report in Google Search Console aggregates structured data syntax errors that prevent Google from identifying the specific structured data type.
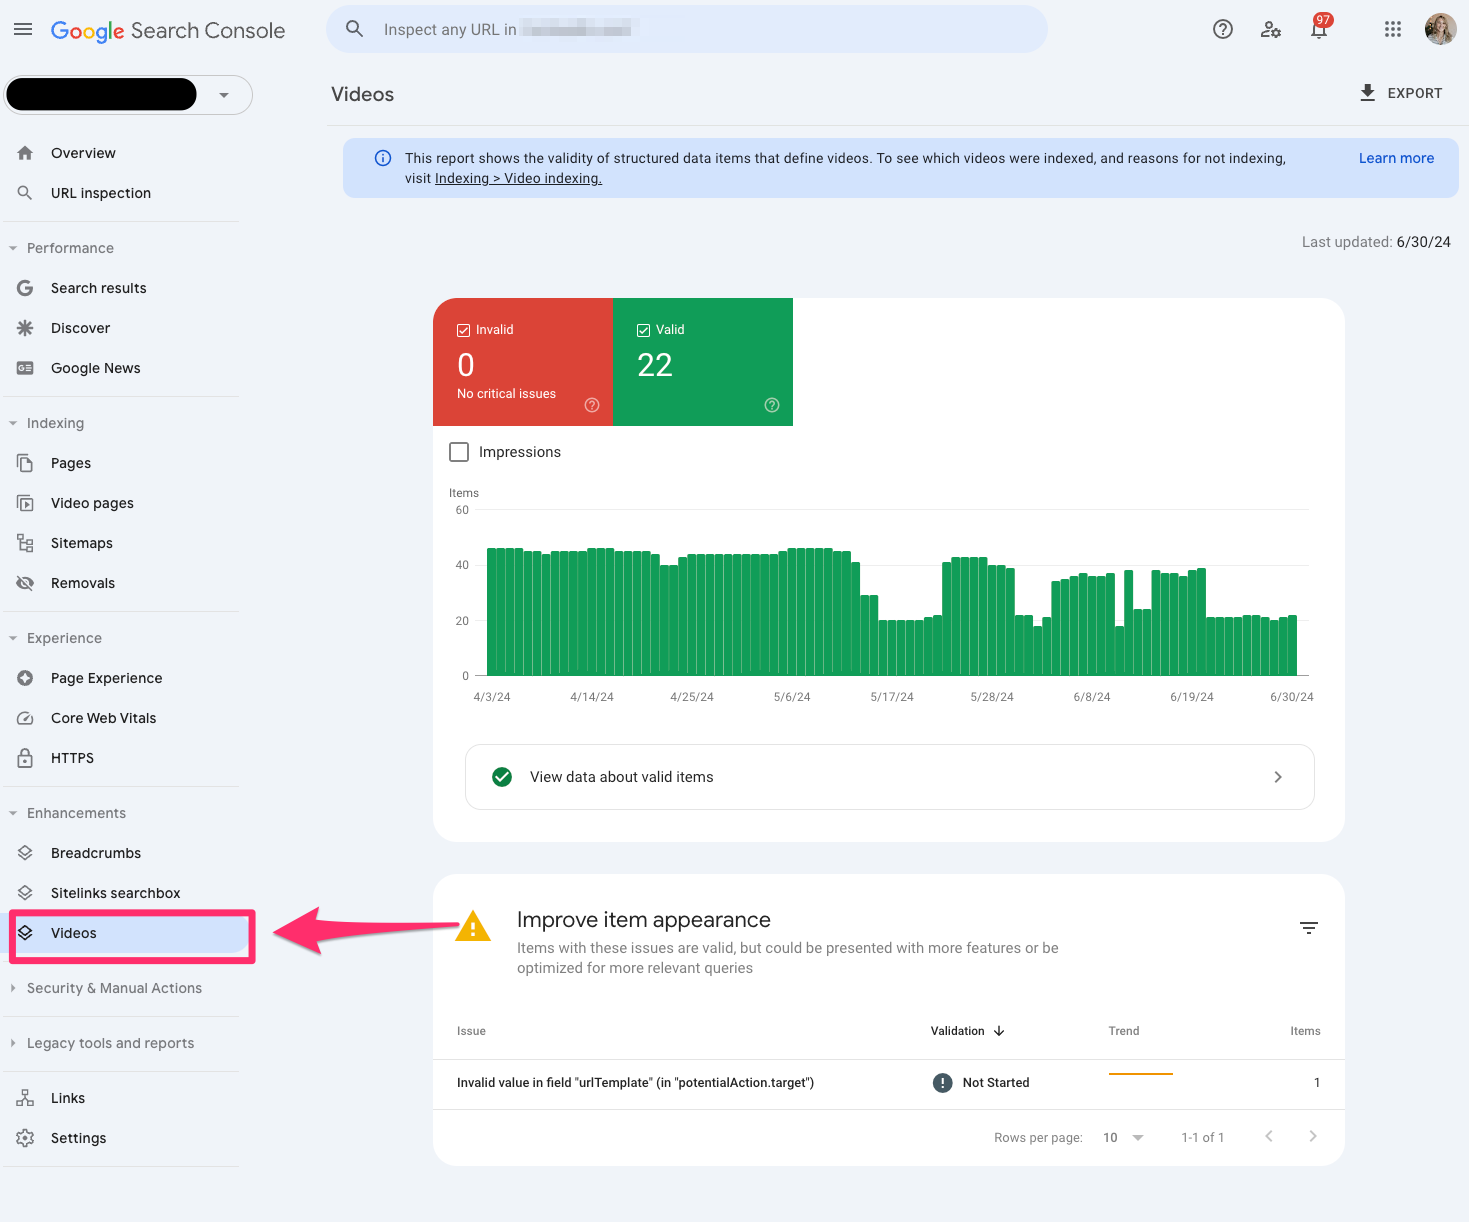
Videos
The video indexing report in Google Search Console has expanded dramatically over the last few years, giving us more detailed information on how your videos perform in search results.
You can dissect whether the video is outside the viewport, too small or too tall. If you’re building a video content strategy, it really helps to elevate your game with your UX team.
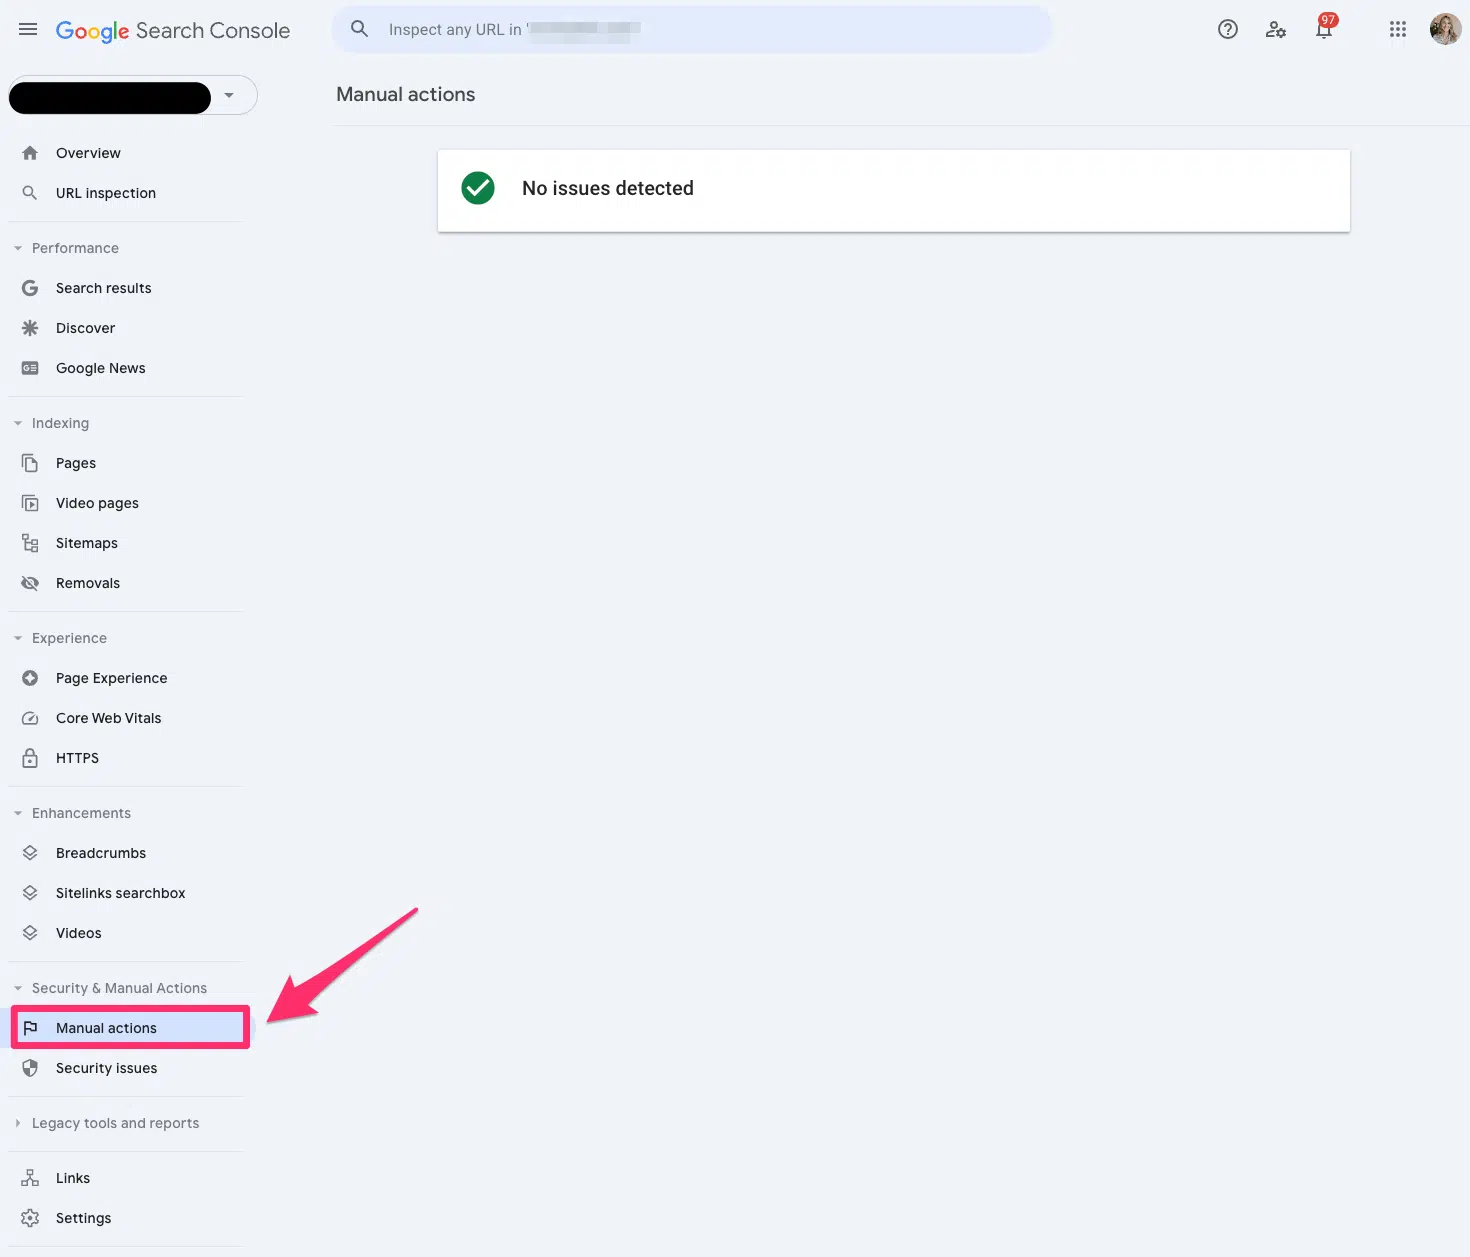
Manual actions
If you’re running your SEO strategy properly, you’ll hopefully never have to worry about the manual action report.
But if you’re one of the unlucky ones who gets hit with a manual action, Google will tell you in this report in Google Search Console.
A manual action occurs when a human reviewer at Google determines that a specific page or pages are not compliant with Google’s spam policy.
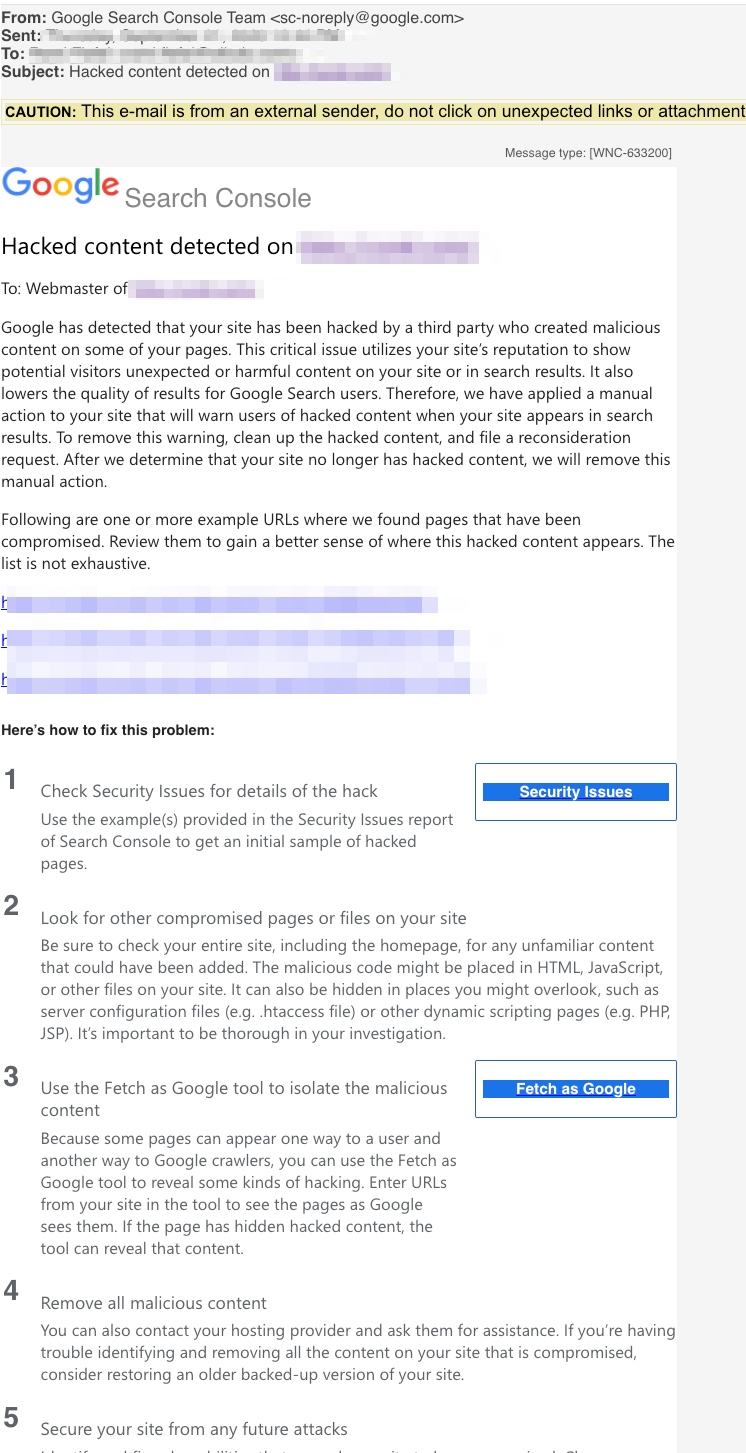
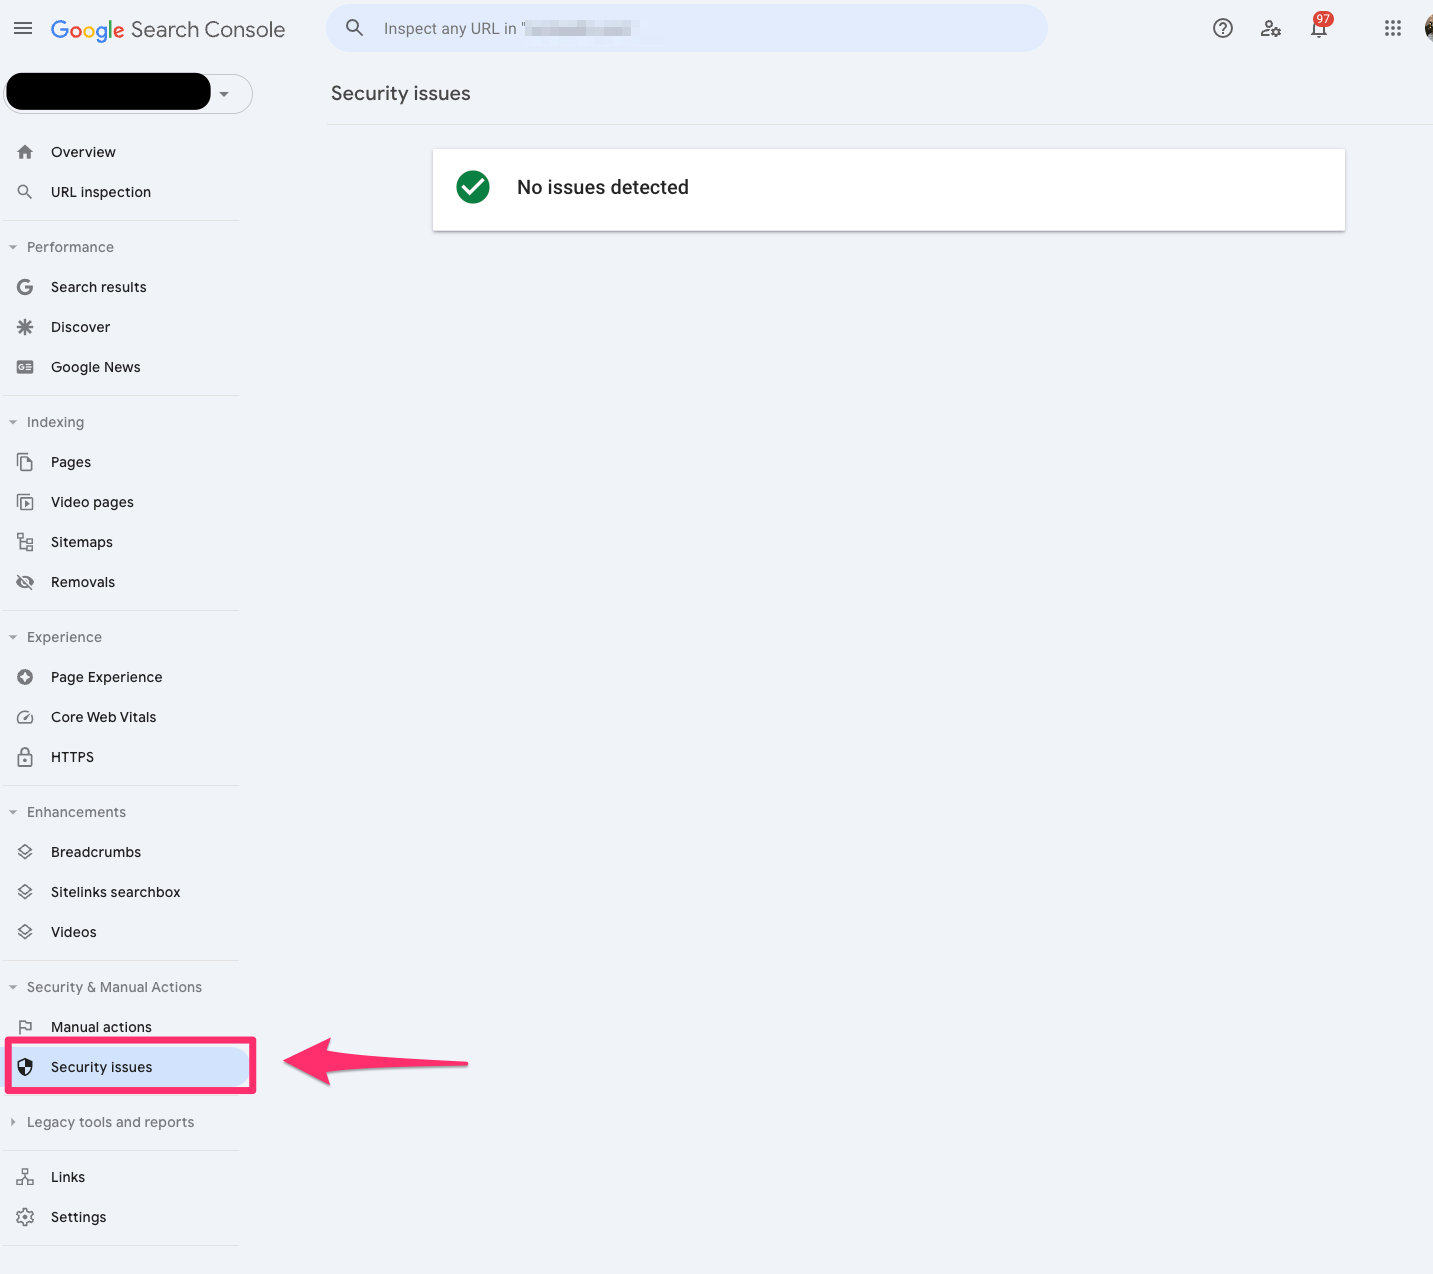
Security issues
The Security issues report in Google Search Console will tell you if your site was hacked or harmful.
Google now emails you to notify you when you receive a security issue.
Check out this beauty I received within the first week of starting to work on a new site.
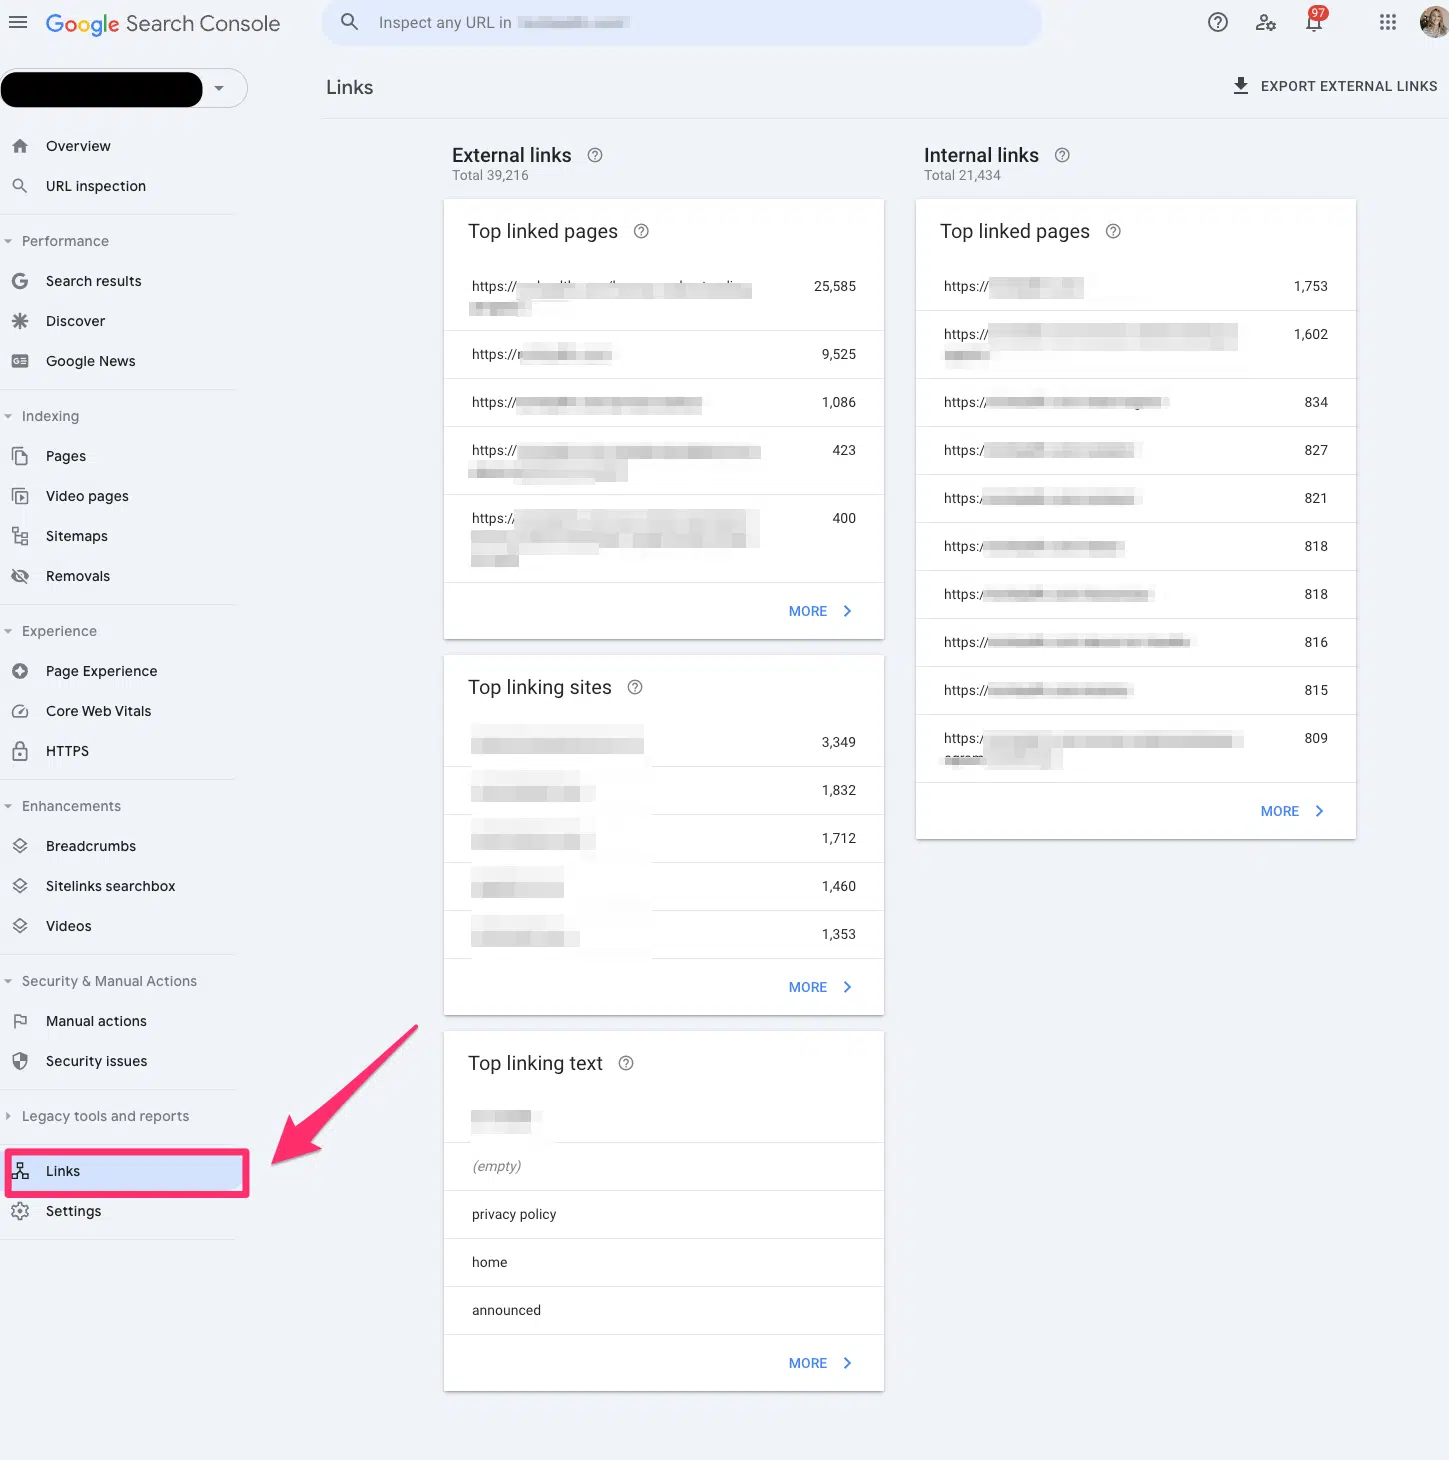
Links
The Links report in Google Search Console allows you to view all your site’s internal and external links. You can view the top link pages, top linking sites and top linking text.
This is a legacy report, so I’d be cautious about relying on it in case Google decides to depreciate it.
Settings
If you need to verify ownership or add a new user, you should check the settings in Google Search Console.
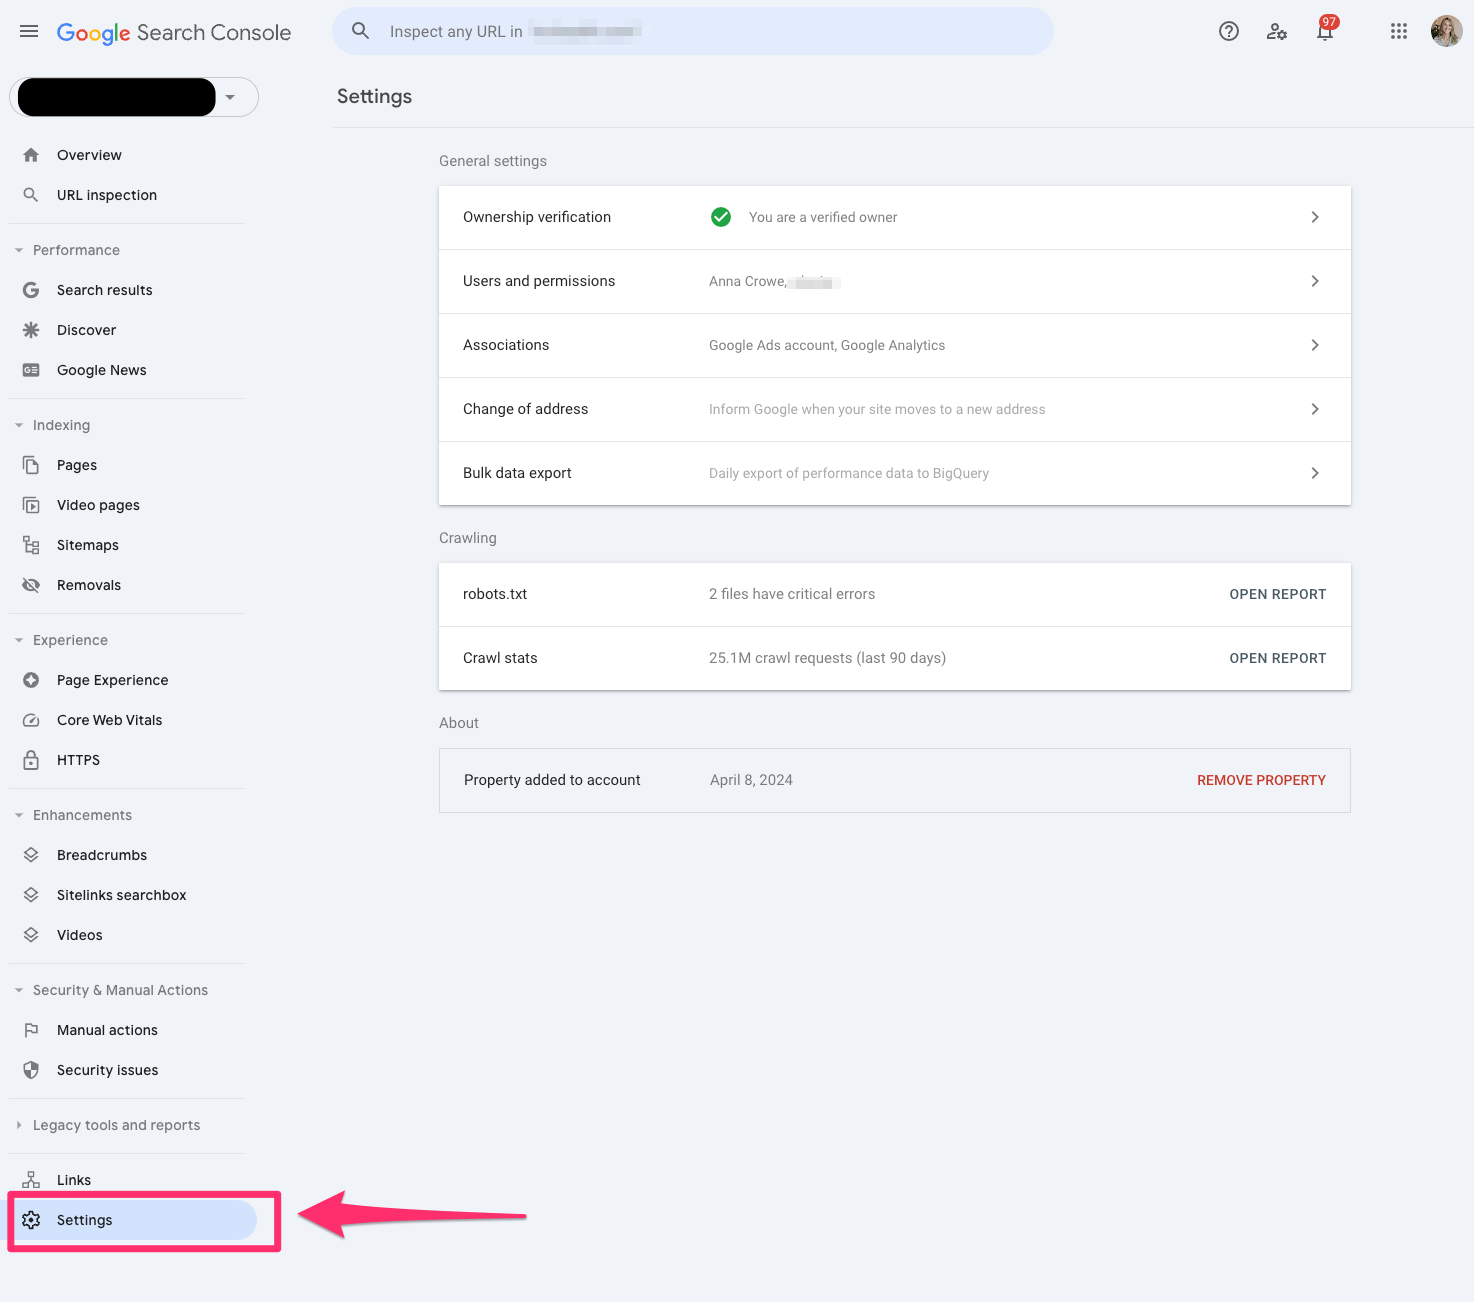
Two cool reports under Settings in Google Search Console go undiscovered, but these are two of my favorite reports.
Robots.txt
The robots.txt report tells us which pages Google can crawl or any potential issues preventing Google from crawling your site.
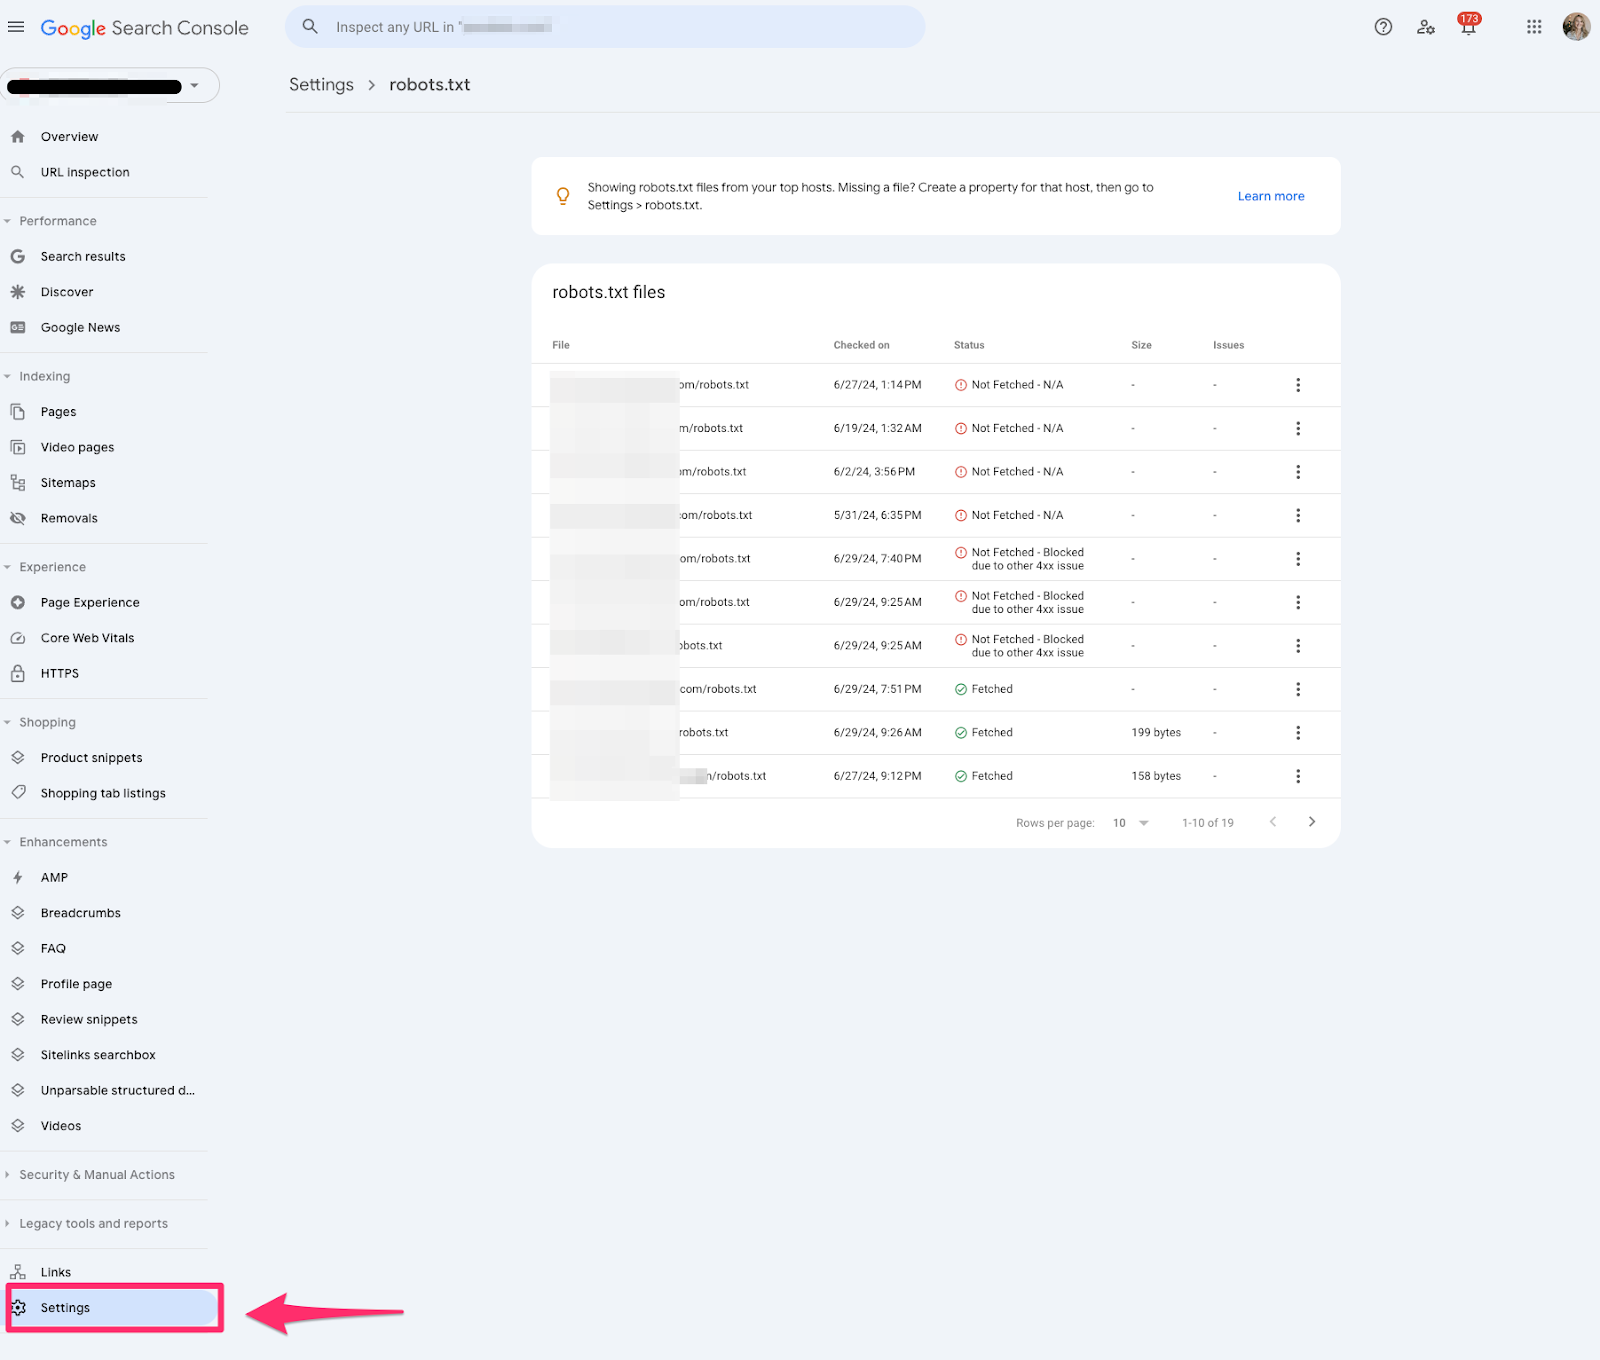
One of the challenges I run into when working with developers is that they often choose to disallow it in the robots.txt file instead of adding a noindex, nofollow tag.
This report will help audit any technical updates with your dev team.
The robots.txt report is only available if you set up a domain property.
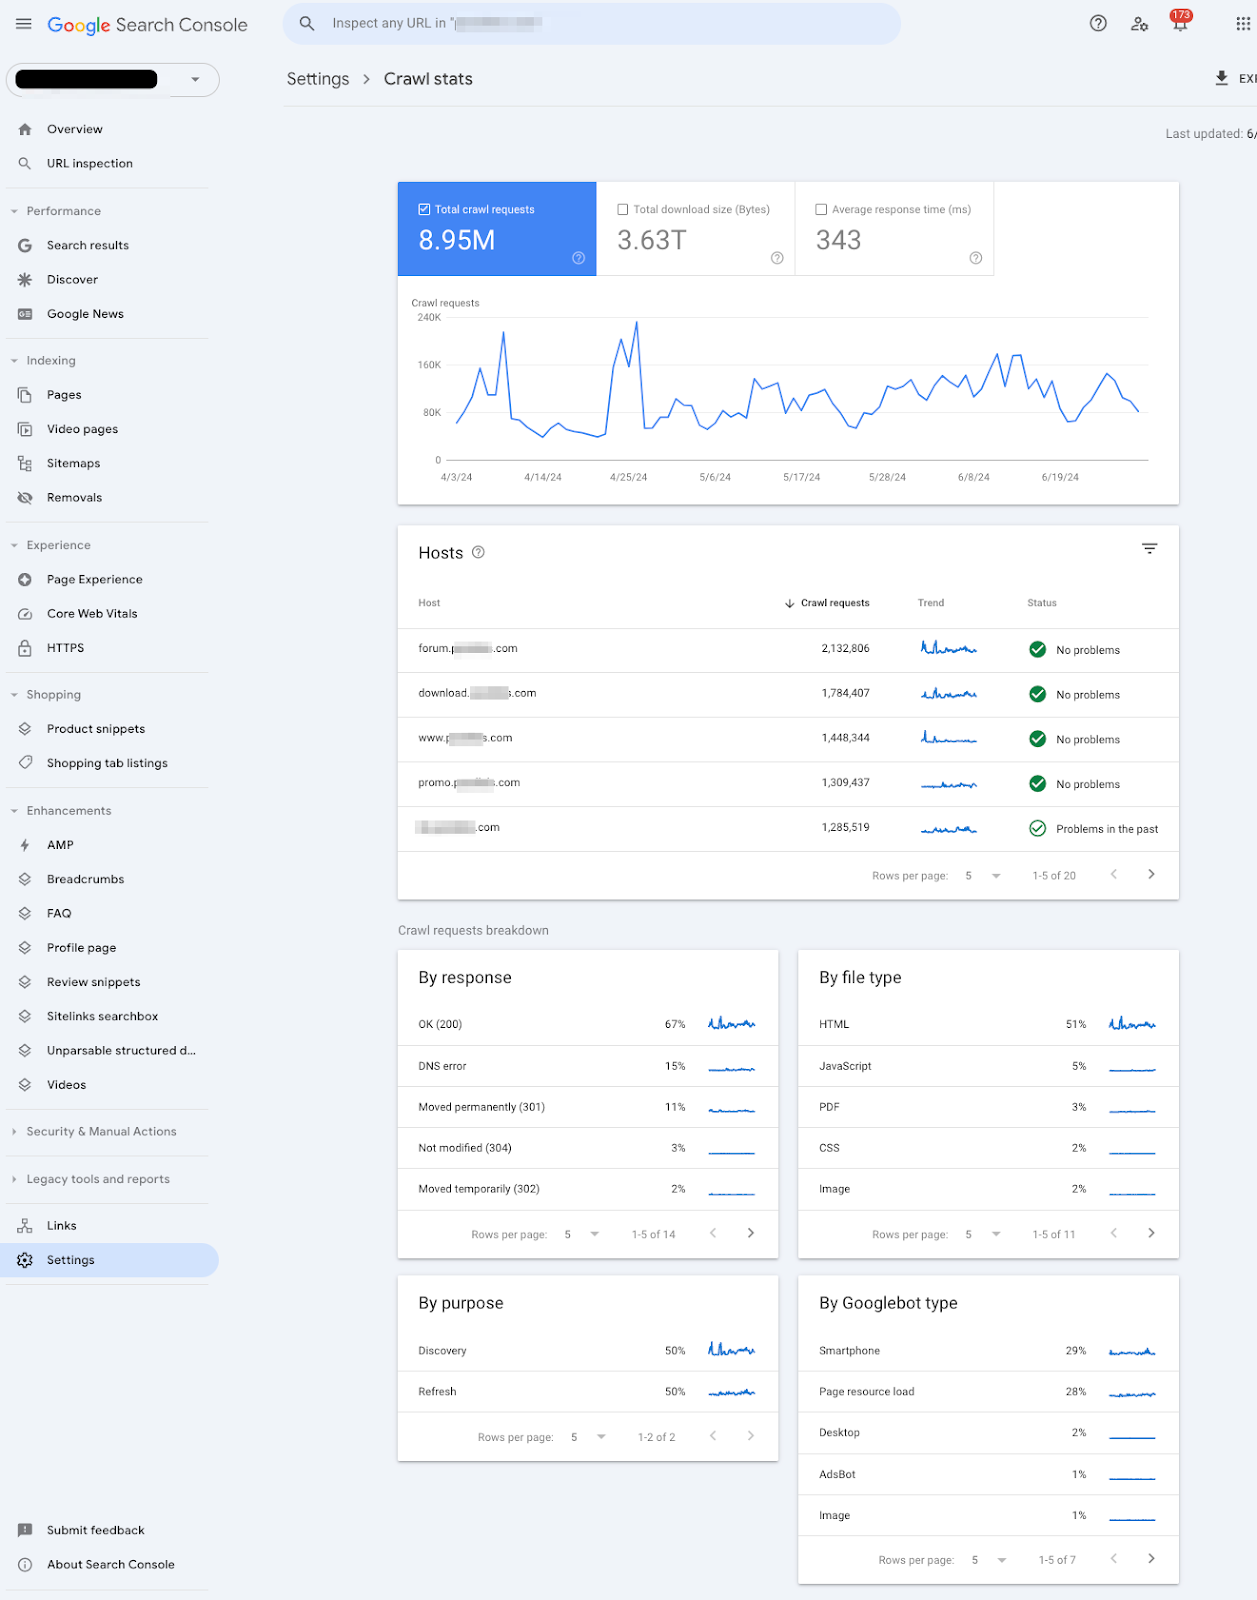
Crawl stats
The crawl stats report shows Google’s crawling history on your website. It can be sorted by how many requests were made and when, server response and availability issues.
It tells SEO professionals if Google is encountering problems when crawling your website.
This report is only available if you have a domain property or a URL prefix at a root level.
Unlocking the power of Google Search Console for better SEO
That’s a lot to unpack. But the gist is that Google Search Console is a place that helps you better understand how your website is performing.
All of the above is just part of the early phases of Google Search Console’s transformation. Google also hopes to add Google’s AI Overviews data in the future. That seems like a worthwhile endeavor, seeing as no tool supports AIO data today.
And I know you all must be hoping Google’s AI Overviews don’t overtake your jobs.
But in the insane event it does, at least you’re covered on how Google Search Console got here today.
Until then, you’ll have to make do with luxe URL inspections, regex filters and manual action surprises.
Contributing authors are invited to create content for Search Engine Land and are chosen for their expertise and contribution to the search community. Our contributors work under the oversight of the editorial staff and contributions are checked for quality and relevance to our readers. The opinions they express are their own.
Related stories
New on Search Engine Land
About the author