5 Simple Ways To Debug Your Google Analytics Installation
As you might guess, we QA a lot of Google Analytics installs. It is often a maddening task that makes you want to “gaq.” However, there are some nice tools that go a long way toward making life easier. If you are questioning the data you’re getting out of Google Analytics; if your e-commerce reporting […]
As you might guess, we QA a lot of Google Analytics installs. It is often a maddening task that makes you want to “gaq.”
However, there are some nice tools that go a long way toward making life easier.
If you are questioning the data you’re getting out of Google Analytics; if your e-commerce reporting doesn’t match your sales; if you really thought there’d be more downloads of your whitepaper on the fonts used in movie credits; then you can use these tools to find out if Google Analytics is broken or if the error lies somewhere else.
This is how we do it.
Things That Go Wrong
Typos
Sometimes we just get things wrong. The Google Analytics developers site references some of the most Common Tracking Code Errors.
Fancy Quotes
We do a lot of our data collection in Microsoft Word. This means the IT departments of our clients are cutting and pasting our code from Word.
If you know what I’m about to say, you’ll have an evil grin on your face.
In its effort to be helpful, Word likes to add fancy quotes to everything you do. Microsoft calls these “Smart Quotes.”
We call them “Fart Quotes” as in “brain fart,” and they turn this:
'product category'
into this:
&rquo;product category&lquo;
You can turn them off after a Dante-like descent into the nine rings of Word configuration, as the MalekTips blog will demonstrate.
Wrong Google Analytics Account
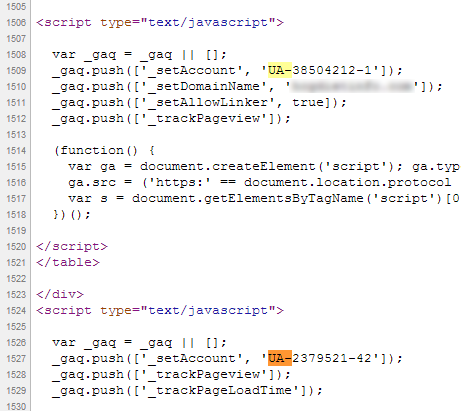
We find all kinds of strange configurations when we start optimizing a website. Often, we’ll be granted access to a Google Analytics account, only to find out that a completely different property ID (as defined by the “UA-#######-#”) is being used.

Viewing Page Source: Two accounts on one page.
Other Google Analytics Accounts
If you use a content management system like WordPress, you might find that some of your plugins also use Google Analytics. The most common one we find is the Disqus comments plugin, which you can only detect with some of the tools I introduce below.
View Source
The most common place to start for debugging your Google Analytics Tracking code is to simply open a key page and view the pages source.
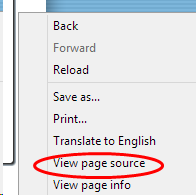
In almost any browser, you simply right click on the page and select “View page source”:
Unfortunately, Chrome’s “Translate to English” option doesn’t help in this scenario.
Once you have the page open, you can search the page just like any webpage (Ctrl+F or F3) for some common Google Analytics strings.
- Searching for “Google” will find the domain that the tracking code uses to download the Javascript files. It will also find all of your AdWords-related tags and code.
- Search for “gaq” to find a common variable found in Google Analytics implementations.
- Searching for “UA-” will help you find out the Property ID found in the tracking code.
You should try this on the following pages:
- Your home page
- Your PPC landing pages
- Your “Thank You” or “Receipt” pages
- Your shopping cart, registration process, or subscription process
Ghostery
An “easier” way to see if Google Analytics is on a page is to use the plugin Ghostery. There is a version for all of the popular browsers.

Ghostery reveals that Google Analytics is on the page. It also reveals other tools that are installed, making it a great way to spy on your competitors.
In the image above, we can see that Google Analytics is installed on the page, but that doesn’t mean that the tool is installed correctly. We can also see that this site has CrazyEgg and Optimizely installed, two tools of the conversion specialist.
If you find these on a competitor’s site, be very afraid.
Generate Data & Look In Google Analytics
Once you feel that you’ve got Google Analytics installed, you can use the tried and sometimes-true method of simply logging in to Google Analytics and seeing if it is reporting data.
If you’re the only visitor to your site, this just might work. Otherwise, keep reading.
Firefox Debugger
I’ve just discovered this debugger for Firefox by Keith Clark, called GA Debugger.
I like the simplicity of this plugin. It shows what Property IDs you come across, which pageviews get generated, Events, Custom Variables and more, even if you navigate across sites. For those new to Google Analytics, you will like the hierarchy of the listing. It shows you how Events and Custom Variables relate to Pageviews in the system.
It doesn’t let you save a log of the data you collect, however, and this can prevent more detailed analysis.
Google Analytics Debugger For Chrome
Google’s debugger is only available as a plugin for the Chrome browser, but it provides the most detailed information of any of the tools I’ve found.
Google provides a debugging version of the Google Analytics Javascript code that generates messages for you as it works. This allows you to see exactly what is being written to your Google Analytics database, and what is not.
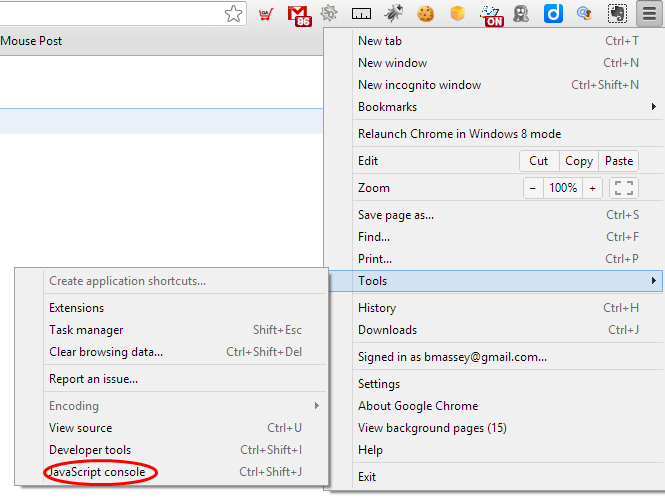
Install the plugin and an icon appears in your extensions list bar. This extension works in conjunction with a built-in feature of the Chrome browser, called the JavaScript console, which you can open by clicking the “Customize and Control Google Chrome” button, and selecting the “Tools” menu. See the following figure.
The information you collect is substantial. Every call is logged along with every parameter. The data collected by Google Analytics is also logged. You can see the Property ID, the URL of the pageview, the domain and referring URL.
You can also QA campaign information, such as source, medium, content and term.
You will be given information on Events, including Name, Type, Label and Value.
Your Custom Variables will be listed, complete with Label and Scope.
It’ll disclose what you are reporting to GA Ecommerce Tracking.
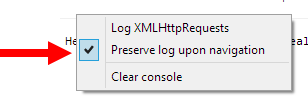
Here’s a helpful tip: If you right-click in the console area, you can select the “Preserve log upon navigation” option, which keeps the console area from being cleared with each new page.
Now, you can cut and paste the contents into a text editor and use filtering and regular expressions to zero-in on just the information you want.
But, we’ll save that kind of analysis for another column.
Contributing authors are invited to create content for Search Engine Land and are chosen for their expertise and contribution to the search community. Our contributors work under the oversight of the editorial staff and contributions are checked for quality and relevance to our readers. The opinions they express are their own.
Related stories


