Cached pages in SEO: What they are and how to use them
Cached pages reveal how Google last saw your site. Learn how to check, troubleshoot, and leverage caches—whether you’re new to SEO or managing at scale.
Back in the good old days, you could type “cache:yourwebsite.com” into Google and get an instant peek behind the curtain to see what Google’s search engines were looking at. In other words, you could see the cached page, Google’s saved snapshot of your site.
For SEOs, this was a quick way to make sure Google was recognizing all your updates and changes. Simpler times, really.
Unfortunately such magic doesn’t exist anymore since Google laid the cache operator to rest in September 2024, leaving many SEOs wondering how they were going to manage without their crawling and indexation crystal ball.
There is hope though—cached web pages didn’t disappear. Google just made them a little harder to find. So long as you’ve got your (metaphorical) shovel, we’ll show you how to dig, because knowing how to access and use cached pages is a feather any seasoned technical SEO should have in their hat.
What are cached pages and why do they matter in SEO?
OK, what exactly is a cached page, anyway? And why should you be taking the time out of your busy day to be adding yet another task on your long list of technical SEO to-dos?

A cached page is like a photograph
When Google’s crawlers (those little bots that look at your site and sort where you should rank) view your pages, they don’t just look at your fresh new blog and then move on. They take a snapshot—a cached version—and store it on Google’s servers.
This isn’t like a screenshot you take on your phone to share with the group chat, though. It’s a detailed technical photograph that captures:
- The raw HTML code Google downloaded from your page
- How your page looked after all the JavaScript on it was executed (and if that code was executed)
- Any text content Google extracted—basically, any copy Google is able to pull from the page (this is how you can tell if a page’s content is being indexed properly)
- The time and date the snapshot was taken
Note: Google handles JavaScript differently than it does static code like HTML or CSS, which Google sees right away. Features written in JavaScript take an extra step to load. Google’s gotten much better at executing JavaScript—seconds instead of minutes now—but it’s still not instantaneous. If your most important content relies heavily on JavaScript to load, you’re essentially asking search engines to wait around while your page gets its act together.
Why does Google cache pages?
The internet is a constantly changing place, and if your page suddenly goes down when someone wants to visit it, Google can reach into its back pocket and produce that cached page snapshot, still providing a quality user experience.
But cached pages act as more than just backups for your pages. They also provide a window into how Google understands your content.
The problem with cached pages
Say you just pushed a beautiful new blog page live. When you look at it, you see your beautiful headers, your artfully designed comparison charts, and your lovely call-to-action buttons leading to product recommendations.
Now, you would naturally assume that Google is getting the same experience. But instead, when you see the cached version of your page, you might find out what Google actually sees: a bare-bones page with just your intro paragraph and no JavaScript-powered elements. Basically, Google thinks your comprehensive guide is just a 200-word fluff piece.
That disconnect between what you see on your page and what Google sees? That’s a big SEO problem. If Google thinks your beautiful new page is about absolutely nothing useful, that new page won’t rank.
Or maybe you’ve just updated your page to include new information, but when you check the cache, you see that Google’s still stuck with the old version from three weeks ago. Now you know why despite all your hard work, you haven’t seen any changes in the rankings.
The SEO toolkit you know, plus the AI visibility data you need.

Basically, a cached version of a page is a search engine’s “official” snapshot of what that page contains. If that snapshot is wrong or outdated, your SEO performance will suffer accordingly.
What’s the best way to check to see how Google is viewing your site now that the cache site operator is dead? Like we said, things are a bit trickier now, but there are a few different ways you can go about it.
How to view cached versions of pages
Since Google got rid of the cache operator, we’ve had to get a bit more creative to find out how search engines see our pages. The good news? You’ve got a lot of alternatives to choose from, and these new options provide even more details than the old cache operator ever did.
Wayback Machine
The Internet Archive’s Wayback Machine is Google’s recommendation. It interacts with your site in a way similar to Google, sending out crawlers to take snapshots of your pages at different points in time.
Think of the Wayback Machine as that friend who likes to take photos at parties: The more popular your party (your website), the more photos that friend (the Wayback Machine) takes.
High-traffic sites get crawled multiple times a day, while smaller sites might only get a snapshot every few months. It’s nothing personal, it’s just resource allocation.
And now, you’ll find the Wayback Machine snapshots linked directly inside Google’s “About This Result” panel, so you don’t even have to go to a separate link.
Say you want to take a look at your blog right now to see what the cached version of the page looks like. To use the Wayback Machine, you would:
- Go to https://web.archive.org/ and enter the page or site you would like to view in the search bar.
- Pick which year, month, and (depending on how often the site was crawled) day you wish to view the cached page on.

- In this case, since Search Engine Land has been crawled a lot, we can pick from almost any day going back as far as 2012. Notice how some of these bubbles are bigger than others? That tells you the site was crawled multiple times that day. And the different colors indicate the response codes for those cached pages:
- Red means you’ll get a 5xx error
- Orange means a 4xx error
- Green means a redirect 3xx error
- Blue means the page returns a 2xx code
- Say you pick the 07:57:47 time on March 10, 2025, to see what the cached version of Search Engine Land’s homepage looked like.

- Now you can see what Search Engine Land looked like back in March 2025. You can even interact with the site so long as the Wayback Machine caches the page you want to click on.

Keep in mind, the Wayback Machine, while useful, doesn’t show you exactly what Google’s crawlers saw. Instead, it shows you what a regular browser would have seen at those specific times. So it’s not a complete picture of how a search engine would have rendered the code on your site.
Google Search Console
Google Search Console (GSC) should be one of your go-to tools for reviewing organic performance. GSC shows you:
- Impressions (how often someone viewed one of your pages in the search results)
- Clicks (how often someone clicked on that page)
- Click-through rate (percentage of impressions to clicks)
- Rank (where your page sits in the search results)
And you can get this data down to the page level over the last 24 hours.
You can even use GSC’s URL Inspection Tool in a way similar to the old cache operator—though GSC’s version is capable of a bit more tricks.
Here’s how:
- You’ll first need to access your Google Search Console account by going to the homepage and selecting “Start now.”
- Enter the URL you would like to inspect in the search bar at the top of the screen.

- You can now see if your page has been indexed by Google. And if your page has been recently updated, you can click “Request Indexing,” though this tool has been rumored to be about as effective as spamming the elevator call button.

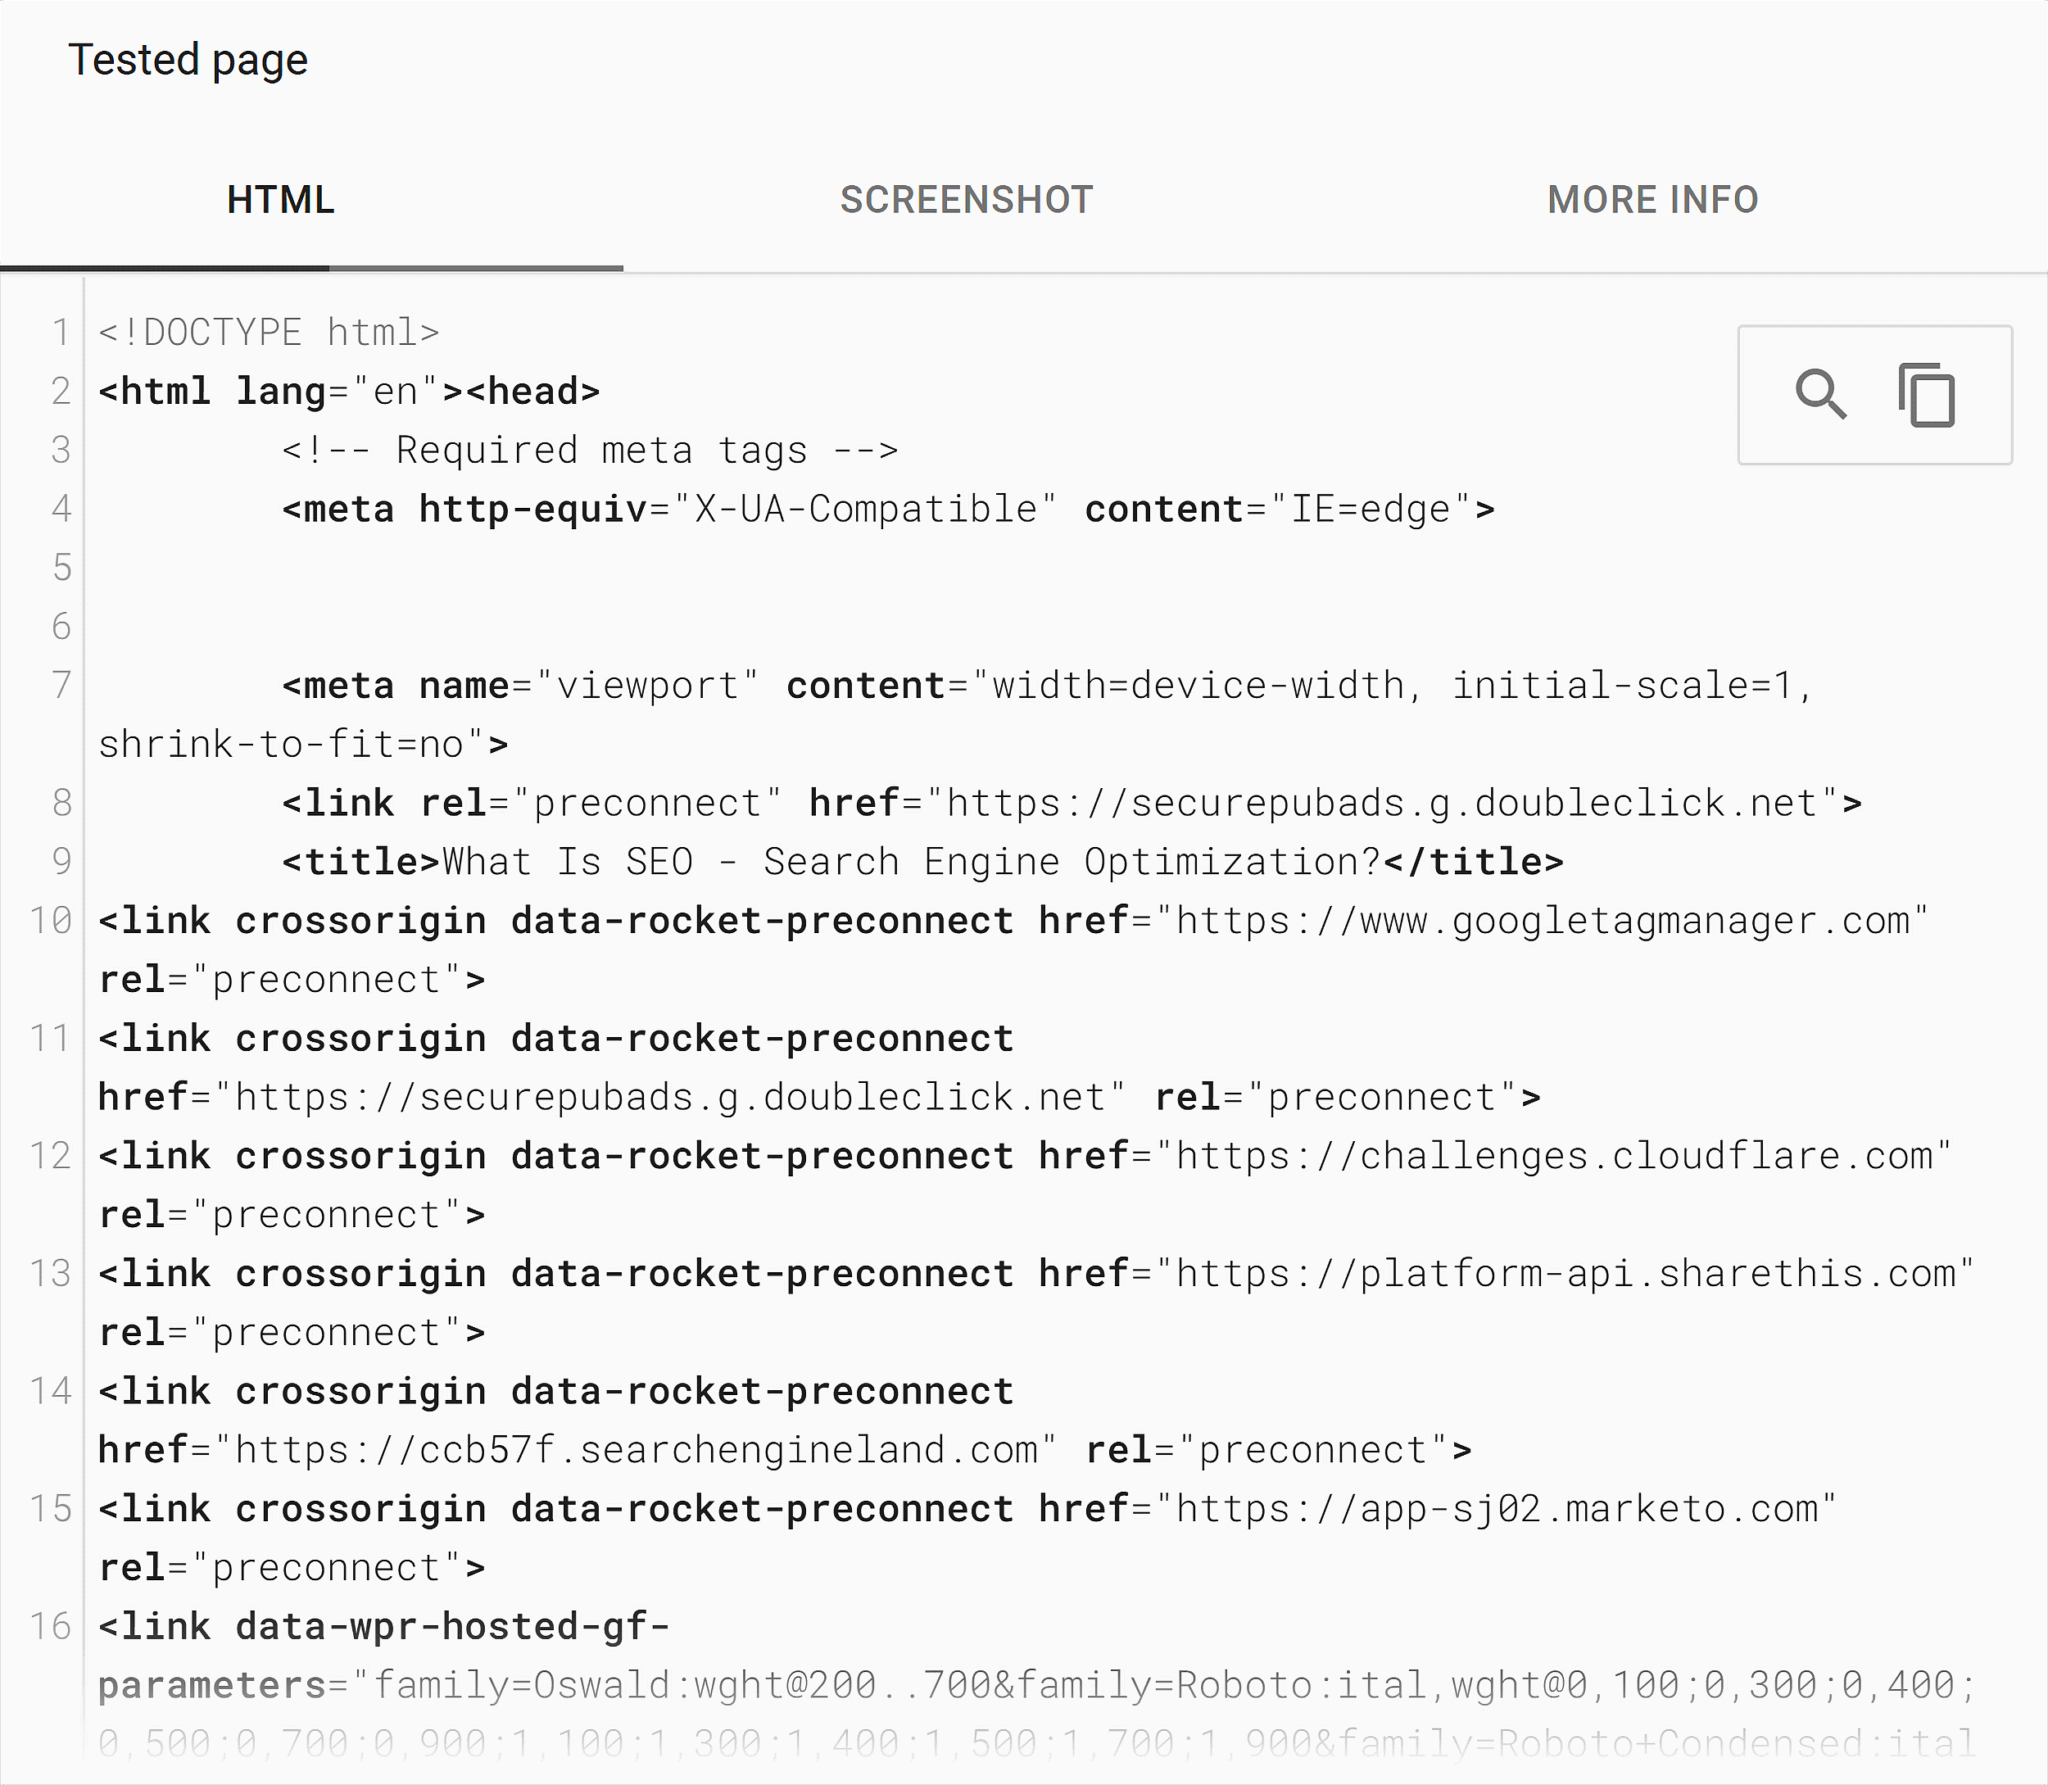
- From here, you can click on “View Crawled Page” to see from Google’s perspective. This is one way to spot any differences between how Google is rendering your content versus how you see your page.
- This features show you three things:
The page’s static HTML:

The “screenshot” version of the page, or how Google sees your page in mobile. (This will take a moment to load):

And additional info about the page:


In all, you can use this URL inspection tool to look at:
- Actual HTML Google downloaded
- How Google rendered the page (after JavaScript execution)
- Screenshots of what Google “saw”
- Any crawling or indexing issues Google encountered
- When the page was last crawled and indexed
Rich Results Testing tool
If you’re working with structured data, or schema, code you can add to a page to help search engines better understand the page (like recipe schema for a chocolate cookie page), you can use the Rich Results Testing tool.
Though this tool won’t get you the same visual depth as GSC’s URL Inspection Tool or the Wayback Machine, it does show you how a search engine is interpreting your schema markup, and, more importantly, if it’s interpreting it correctly.
Pro tip: If you’re looking to test schema, you can also use the Schema Validator tool—which tends to have shorter loading times.
This tool is also relatively simple to use:
- Go to the Rich Results Testing tool and enter the URL you would like to test.

- You can now see the structured data used on the page you’re testing under “Detected structured data.”

- Similar to Google’s URL inspection tool, you can also click on “View Tested Page” to view the same data as GSC’s URL inspection tool: the HTML code, rendered page, and additional info.
Pro tip: Turn to the Rich Results Testing tool when you aren’t seeing any of your optimized rich snippets (star ratings, location information) appearing in the search result pages.
Third-party tools
There are also third-party tools like Screaming Frog and Sitebulb to fill the gap left behind by the cache operator. These tools can:
- Emulate how search engines crawl your site so you can audit for weaknesses
- Take screenshots of how your pages render
- Compare different versions of your pages over time
- Identify rendering discrepancies
These tools do come with their own pros and cons compared to other recommendations. The obvious con here: They cost money, whereas the previous recommendations are all free.
But that trade-off means you can get sneak peaks of your competitors and in-depth insight into how search engines are rendering their JavaScript.
Here’s how you can use Screaming Frog to see your site from a search engine’s perspective:
- Open up your Screaming Frog tool and enter the domain you’d like to analyze.

- Make sure your tool is set up to store all of the resources you’re going to crawl. Do this by going to “Configurations” > “Spider” > “Crawl.”
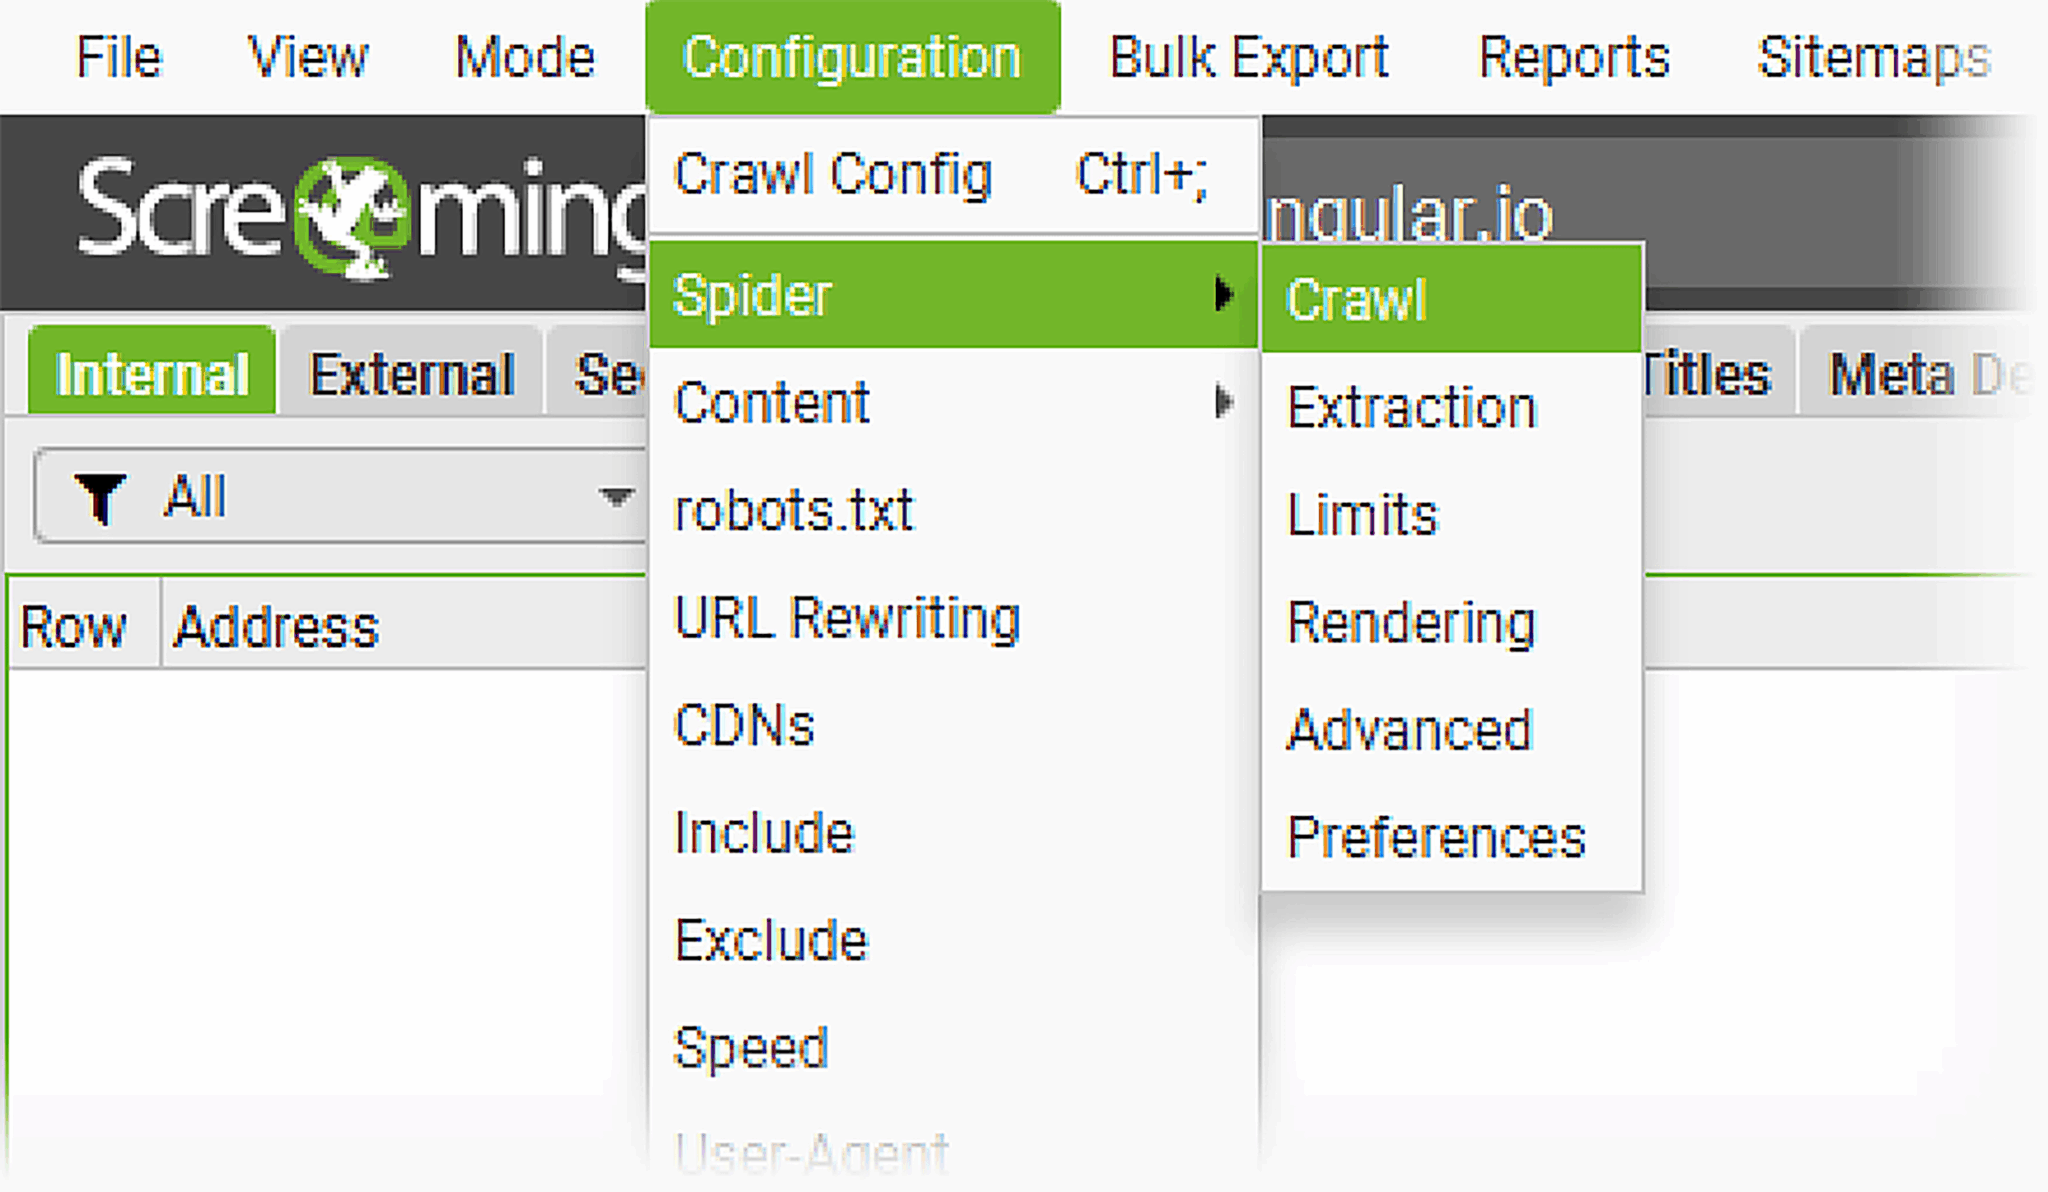
- Then, highlight all of the resources you want to store. In this case, you’ll want to tick all of the resources in the first section, at the very least crawl and store internal and external links, canonicals, and store pagination and hreflang (if your site has translations).
- In the same “Spider Configuration” box, go to “Rendering” and change the rendering process from “Text Only” to “JavaScript.”
- You’ll want to update the Window Size if you haven’t already used “Google Mobile Smartphone” instead of “Googlebot Desktop,” since Google is a fully mobile crawler. Hit “OK” to finalize your selection.
- Click “Start” to begin the crawl. Expect this crawl to take a while and use a lot of resources on your computer.
- Once the crawl is completed, you can view the rendered pages to confirm they’re appearing as they should. Do this by navigating to “Internal,” and click on “HTML.”

- Select the URL you would like to inspect, then navigate to the bottom and select “Rendered” to see how the page appears.

- Compare how the page appears once rendered to confirm all high-priority assets are appearing as they should.
How to use cached insights without the cache operator
You might have noticed that without the cache operator in hand, diagnosing crawl and indexing issues requires a bit more detective work. Like most things with technical SEO, you’ll need to work backward from a problem and gather clues by using multiple tools to piece together what happened.
This approach does have its advantages. It means you get to paint a much fuller picture than what you could have been capable of with just the old cache operator, even if it does take a little extra legwork.
Before we dive into how you can get to the bottom of these issues in this new world, you should be aware that there are three common issues that result in a search engine not seeing your page the same way you do.
Crawling issues
These take place when your server throws up roadblocks (think broken server responses, overly restrictive robots.txt files, or pages with slow load times), which means that search engines can’t reach your page. The biggest sign that you’re suffering from this problem is if you perform a log file analysis and notice that your server logs show no crawler activity, or if GSC shows crawl errors.
Rendering issues
These take place when a search engine has successfully crawled your page (so you see raw HTML in GSC’s URL inspection tool), but the rendered version of the page is missing content or looks broken. The problem here is that your JavaScript isn’t properly loading for crawlers.
Indexation issues
These take place when search engines can crawl and render your page just fine, but the page isn’t appearing in search results. The culprit here is a bit more complex, but this often happens when you have issues with duplicate content.
Note: These three issues often masquerade as each other, which is why diagnosing problems without the cache operator requires serious detective work. A page might appear to have indexation issues, when it’s actually a rendering problem in disguise. Prepare to test your page in different ways to confirm you’ve found the correct issue.
Use GSC’s “Crawled Page” view
Let’s say you’ve noticed there’s been something off about your new blog page, “The Ultimate Guide to French Press Coffee Brewing,” and you think it’s likely an indexing issue. Your first step to diagnosing this issue would be to go to Google Search Console.
You’ll remember the URL Inspection Tool.
To investigate our blog page, we’ll want to look at the “Crawled Page” view. When you test a live URL here, this gets you two critical pieces of information:
- The raw HTML Google pulled from your server
- The rendered page Google gets after executing your JavaScript
Because remember: Google looks at your static HTML code first and then has to take an extra step to see what’s been rendered in JavaScript. Looking at the difference between the two is one of the first steps in performing a JavaScript audit.
These two views are a first big step in understanding what might be causing your page to not rank. You’re basically looking at the ingredients of a recipe versus the finished dish—if there’s a massive disconnect between the two, you’ve found your culprit.
Let’s take our coffee blog page as an example.
Say you link out to a few relevant products like coffee grinders and pour-over equipment. The prices for these products in HTML show $50 per grinder, but because JavaScript dynamically updates that price based on the user’s location, it shows $59 in the rendered page.
If you then see that Google’s showing a $50 price in the search results, you can be certain the issue isn’t crawling—it’s something to do with rendering, or JavaScript SEO.
Figure out rendering differences
So, you’ve spotted a rendering difference. These are, unfortunately, common for websites, and can be a silent killer for organic performance. Your page looks perfect in your browser, but if search engines can’t execute your JavaScript correctly, they’re getting a completely different page experience.
And while rendering problems are a common culprit, they’re far from the only issue—we’ll get into other troublemakers later in the article.
How exactly can you fix this issue?
First, you’ll want to compare the raw HTML to the rendered output. Go back into your detective role. Look for any JavaScript-dependent functions and/or differences in:
- Page titles and meta descriptions
- On-page copy
- Navigational elements
- Structured data markup
- Internal links
- Page layouts
Basically, if Google’s rendered view doesn’t show something, that’s a problem you need to fix.
You’ll also want to check rendering timestamps. This tells you what time Google finished crawling a page, and what time it finished rendering it.
A notable delay between those times—or if the rendering has failed entirely—is a red flag. This means Google’s having trouble executing your JavaScript, which is likely because of:
- Resource-heavy scripts
- Slow-loading external dependencies
- JavaScript errors that are causing the rendering process to crash
Combine insights with log file analysis
But you don’t have to stop there. You can always dig deeper with a log file analysis. This basically means pulling the server logs from your site to see which search engines visited your site at what times. You can use Semrush’s log file analyzer or Screaming Frog’s log file analyzer to do this.
First, you’ll need to get your log files. Do this by downloading them from your server. Some hosting platforms like Hostinger have a built-in file manager where you can download your files:
- Simply log into your account and look for a folder named “File Management,” “Files,” “File Manager,” or something similar. Here’s what this looks like on Hostinger:

- Click on that folder to open it and download your files. You can also ask your developer or IT specialist to access your server and download the files through an FTP (file transfer protocol) client.
- Once you have your log files, make sure they’re unarchived and in either a W3C, Kinsta, or access.log file format.
- Now you can drag and drop your files into your log file analyzer tool of choice:

- Give your results a moment to load. What you’ll see once things are ready are:
- Your site’s HTTP status codes (5xx, 4xx, 3xx, etc.)
- The types of files crawled
- Which search engines are crawling your site
- How often they’re crawling

- Scroll to “Hits by Pages” to see which pages and folders search engines crawl most often. Use this information to figure out how quickly you’ll see rankings change with new page updates or additions:

You can then compare this data with Google Search Console, which shows you Google’s perspective on what happened during those visits—like if your page was successfully crawled, rendered, and indexed.
Overlay these two datasets, and look for patterns and differences.
Note: Server-side rendering (SSR) is when you generate fully-formed HTML before sending it to browsers or crawlers, allowing you to eliminate JavaScript delays entirely. Essentially, it’s like having your page pre-dressed and ready to go before any search engines arrive, instead of making crawlers wait while you finalize your lip liner.
Maybe you notice that according to your logs, Googlebot visited your new page 10 times last week, but GSC only shows the page was rendered once. This would confirm your theory that Google might be having trouble processing your JavaScript—or that there might be server-side issues impacting your content.
On the other hand, you might see that Googlebot visited your page only once according to your logs, but GSC reports multiple successful renders. This could indicate that Google is efficiently caching your content and doesn’t need to re-crawl it as often.
You can see the power of combining your log file analysis with GSC data: Your log file analyzer gets you a complete picture of when and how crawlers visit your site, and GSC shows you what Google actually did during those visits.
Deal with vanishing cache
OK, let’s say your detective work takes a different turn: You notice when looking at your page in GSC’s inspection tool that Google is simply not showing the cached version of your page. Or there’s a significant difference between what you expected to see.
This is a signal that there’s a deeper problem going on with your site.
If you’re not seeing the page at all, look at these common culprits first:
- Server response codes: Is your page returning a consistent 2xx code?
- Robots.txt file: Did you somehow end up blocking your new blog page?
- No-index tags: Did you somehow accidentally add a tag to your new page?
- Page load times: Is your new page just loading too slowly?
If you’re seeing the page but the cached version looks very different from what you expected it to be, you’re likely dealing with:
- Canonicalization problems: These occur when search engines can’t figure out which version of similar pages is the “real” one, or the page that should be cached.
- Duplicate content: This happens when you create multiple pages with similar content, which confuses search engines about which version to cache and rank.
- Content injection: This occurs when malicious code gets inserted into your pages, often through compromised plugins. If you see random ads, gambling links, or unrelated content in your cached pages, your site has been hacked. This is a major problem that will hurt your SEO when search engines flag your page for spam, and also get your site flagged as malicious, killing your traffic overnight.
Identify soft 404s
One sneaky issue you might encounter as you troubleshoot is soft 404s. These are pages that return 200 status codes, telling search engines “everything’s fine!”, but in actuality, they display error content or an entirely empty page.
Beyond gaslighting you, these pages can be a problem because they waste crawl budget and also confuse search engines as to what the actual content of the site is.
Common places you might spot soft 404s include:
- “No results found” pages that still return 200 status codes
- Product pages that show “out of stock” with minimal content
- User-generated content pages that are basically empty
- Search result pages with no actual results

Here’s an example of what a soft 404 looks like:
GSC will report on soft 404s under the Indexing > Pages report:
You might see the error appear like this:

But you can also identify these pages on your own by comparing the raw HTML and rendered views in GSC. If you notice pages that have very little content but normal status codes, you might have a soft 404 page on your hands.
Interpret crawl frequency
You might think you have a strong hypothesis for your problem based on the tests you’ve done so far, but you should still follow through with this last step because it’s something many SEOs miss: crawl frequency.
How often search engines recrawl your pages tells you a lot about how Google perceives your page’s importance.
If you notice that your pages are being crawled frequently, you can assume:
- Google thinks your page is important
- The content of your page probably changes frequently
- Your page gets notable engagement and/or traffic
- Your page is well-linked to from other important pages
On the other hand, if you notice a low crawl frequency, that likely means:
- Your page is considered less important
- Google doesn’t expect the content to change often
- Your page might have technical issues that hurt crawlability
- Your page isn’t well-integrated into your site’s linking architecture
If you notice that your page is suffering from low crawl frequency, especially in comparison to other pages on your site, try these strategies to improve recrawl rates:
- Update your content more regularly
- Add internal links from frequently crawled pages (we’ll get into internal linking strategy more in a moment)
- Make sure your problem pages are included in your XML sitemap (basically a map of all the pages on your site that should be ranking)
How to optimize crawl budget and indexation without cache data
Think of a crawl budget like a search engine’s attention span for looking at your site. Even Google doesn’t have infinite time and resources, so it only allocates a certain amount of time to crawl your site.
And if you’re wasting that budget on low-value pages, your important content won’t get crawled as frequently, which means it will take far longer to see ranking and traffic improvements after you make changes.

Without easy cache access, understanding how Google spends this budget means combining multiple data sources to get to the truth. In this case, you’re going to look at your crawl logs and the URL inspection tool again.
Identify crawl waste
Say you notice that your high-priority blogs are all lagging when it comes to ranking improvements, even after you’ve made a lot of quality changes. So you want to confirm that you’re not experiencing a crawl budget issue.
The first way to do this is by going back to your crawl logs and GSC’s URL inspection tool. Your logs are like a diary of every time any search engine has visited your site.
Cross-reference those entries with your URL inspection tool to look for two things:
- Crawl waste
- Spot crawl starvation
Crawl waste occurs when low-quality pages that don’t drive meaningful traffic or conversions keep getting crawled. Common causes of this issue include:
- Parameter-heavy URLs from internal search (like https://searchengineland.com/search?query=seo)
- Archived content that’s no longer relevant (like old event pages, discontinued product pages, or outdated company news)
- Duplicate or near-duplicate pages (like having both /coffee-brewing-tips and /how-to-brew-coffee with nearly identical content)
- Admin or staging pages that accidentally become crawlable (like /wp-admin/test-page or /staging/new-product-launch that should be private)
On the other hand, spot crawl starvation takes place when Google isn’t visiting your important pages. This often happens when important pages are:
- Buried too deeply in your site architecture
- Missing internal links from important pages
- Not prioritized in your XML sitemap
Now you know what the likely cause is of your high-priority blog page not ranking, but how do you fix it?
Consolidate content to reduce crawl waste
This solution is exactly what it sounds like. Low-value pages on your site are stealing budget from important content. And yes, you will have to kill some of your darlings here.
Here’s the best way to go about culling content:
- Combine thin content pages. If you have multiple pages covering similar topics with only a few paragraphs of content, combine them. One strong page is better than five weak ones.
- Update or remove outdated content. A blog post about “Best SEO Trends” from several years ago is a historical relic and should be laid to rest. Either update it or remove it.
- Delete placeholder pages. “Coming Soon” pages that were never properly developed from years ago should be laid to rest.
Improve internal linking structure
Internal links, or links that point from one page on your site to another page on the same site, are how users and crawlers move around your website. Search engines use these links to understand how pages are connected to each other, which means your internal linking structure is a great place to optimize for crawl budget and indexation issues.
Here’s what you should do if you’re trying to optimize your site’s internal linking:
- Create topic clusters. Basically, link like pages to like pages. If you’re writing about sustainable coffee, that means you should link out to brewing methods, bean sourcing, and equipment reviews.
- Use descriptive anchor text. Anchor text is the words in a link that you click on to go to a linked page. You’ll want to avoid generic “read more” or “click here” copy, since both search engines and users use this information to understand what the linked page is about. Take your sustainable coffee blog: If you’re linking out to a brewing methods page, you would want to use anchor text like “how to brew coffee.”
- Prioritize important pages. The more internal links pointing to a page, the stronger signal you’re sending about its importance, so your main category pages should be easily accessible from anywhere on your site.
- Keep things natural. Use the Goldilocks approach when you’re adding internal links to a page—you don’t want to add too much, and you don’t want to add too little. There’s not a hard and fast rule here, but too few internal links means you’re not giving your readers (and search engines) enough of an opportunity to explore your site, and too many links can be overwhelming for users.
Pro tip: The sweet spot for the number of internal links is about two to five contextual links per 1,000 words of content. But you should focus more on what makes sense for your readers, not just numbers.
Update your XML sitemap
Your XML sitemap is a map that tells search engines which pages on your site matter most. That means it should be updated with every new page added to your site.
Keep your XML sitemap optimized by:
- Removing low-value URLs
- Updating it on a regular basis
How to handle sensitive or outdated cached content
Sometimes you might have the opposite problem: Pages that you want search engines to ignore keep appearing in result pages.
These pages might contain sensitive information, pricing errors, or embarrassingly outdated content that’s better off forgotten. Luckily, it’s a bit easier to make a page disappear than to make a search engine pay attention to it.
You’ve got two options here:
- Add a noarchive tag
- Go nuclear with a removal request
noarchive tag
The noarchive meta tag is basically a piece of code you can add to your page that tells search engines “no pictures please.” In other words, it prevents them from caching a page. Even in a post-cache operator world, this tag is still respected by search engines.
You can implement this by simply adding this code to your page’s HTML head section:
<meta name="robots" content="noarchive">
Say you accidentally pushed a page live for your sustainable coffee company that lists outdated pricing information, and you’re dealing with an influx of customer service issues because of it.
To fix this and prevent it from happening again, you would:
- Immediately add a noarchive meta tag to the page to prevent future caching
- Implement dynamic pricing so the page doesn’t cache inappropriately
- Use GSC’s URL Inspection Tool to verify Google has picked up on these changes
Note: The noarchive tag doesn’t affect third-party archiving services like the Wayback Machine. If you need a complete removal, you’ll need to go with the removal request option.
Removal request
When the noarchive tag isn’t cutting it—or if you need to remove content that’s already been cached by third-party sites—you’ll want to turn to:
- GSC’s URL removal tool
- Bing Webmaster Tools
- Internet Archive exclusion requests (the best way to submit these is by contacting the Internet Archive)
GSC’s URL removal tool should be your first stop for emergency removal. You can request temporary blocks (which is about six months) for:
- Entire directories
- Pages
- Specific URL parameters
This is only a temporary removal. For something permanent, you’ll need to either delete the page or block it with a robots.txt file—basically a rulebook telling search engines what pages it should and should not access on your site.
For example: If you’ve published a blog on coffee pricing, only to realize you’ve used outdated information.
Fix this by:
- Using GSC’s URL Removal tool to temporarily block crawlers from accessing the page.
- Updating the blog with the correct information, or deleting the blog entirely.
Bing Webmaster Tools should be your next stop. Bing has its own URL removal tool that works similarly to Google’s, so this isn’t a permanent solution, but a temporary stopgap.
Internet Archive exclusion requests are your ticket to getting a cached page off the Wayback Machine. Do this by either contacting them directly to remove pre-existing content, or add a specific robots.txt entry like this:
User-agent: ia_archiver
Disallow: /sensitive-content/
Disallow: /private-documents/
Then, you would want to:
- Delete the content immediately.
- Use all available removal tools.
- Get in touch with the Internet Archive right away.
- Audit your robots.txt file to confirm what search engines have access to what pages.
AI and cached pages
When it comes to AI, things get really interesting (and maybe a little speculative). With LLM-powered searches like ChatGPT continuing to rise and AI Overviews (those AI-generated answer boxes that appear at the top of Google search results) showing up for almost every query, the role of a traditionally cached page is evolving rapidly.
How AI handles cached pages differently
From what we understand so far, AI Overviews and LLM-based search engines don’t seem to rely on cached pages directly in the same way original search engines do.
What this means for SEOs:
- Content freshness signals matter more than ever. AIs like Perplexity, Claude, and LLM-powered search engines prioritize recent information over cached versions, which means fresh, accurate content gets rewarded faster.
- Entity recognition is crucial. AIs excel at recognizing entities (people, places, things), so you should clearly define key terms and concepts in your content, use consistent naming conventions, and structure your content with clear headings to help AI understand what every section is about.
- Comprehensive coverage helps. Pages that thoroughly cover topics by providing specific examples and nuanced details perform better than AI-generated responses that tend to just skim.
How AIs vs. traditional search engines handle cached pages
| Feature | AI-based search | Traditional search |
| Stores complete page snapshots | ❌ | ✅ |
| Uses cached pages as backup when sites are down | ❌ | ✅ |
| Prioritizes content freshness over cache age | ✅ | ❌ |
| Focuses on extracting specific information | ✅ | ❌ |
| Uses cached content for ranking decisions | ❌ | ✅ |
| Compares multiple cached versions over time | ❌ | ✅ |
| Synthesizes information from multiple sources | ✅ | ❌ |
| Understands context and entity relationships | ✅ | ❌ |
| Provides direct answers rather than page links | ✅ | ❌ |
| Shows users cached page snapshots | ❌ | ✅ |
| Considers page loading speed from cache | ❌ | ✅ |
| Uses cache timestamps for content dating | ❌ | ✅ |
How SEOs should adjust their cached page strategy
AI isn’t the only thing that’s changing when it comes to cache. Google’s de-emphasis on public cache visibility is part of a broader shift toward encouraging websites to monitor their own crawl and rendering statuses instead of relying on Google.
Track, optimize, and win in Google and AI search from one platform.
The good news is that you can use AI tools to:
- Analyze crawl logs for patterns you might miss manually
- Identify pages that need updating based on staleness signals
- Predict when Google is likely to recrawl specific pages based on historical data
How should you change your SEO strategy to adjust?
- Invest in better monitoring. Look into tools like Screaming Frog, Sitebulb, and OnCrawl which can continuously crawl and render your pages for better monitoring.
- First-party data is king. Your own analytics, crawl logs, and rendering tests are the best way to keep a pulse on your site’s performance. Don’t neglect that data.
- Real-time optimization. Don’t just wait to see what Google caches. Optimize for what Google will see on its next crawl.
Integrate caching into your technical SEO strategy
Without the cache operator, your technical SEO diagnostics need to be more sophisticated. But digging deeper also gets you more information. Think of this as upgrading from a basic toolkit to a professional workshop: It’s more complex, but more powerful.
The key to handling this shift is adapting to a detective mindset: Combine multiple data sources, automate what you can, and focus on understanding the “why” behind crawling and indexing issues instead of just identifying that they exist.
Your future self will thank you for building out a more robust diagnosis process, especially as search engines keep evolving toward AI-driven systems that might make traditional caching less and less relevant.
Check out some of our other resources on technical SEO: The goal isn’t to have the “perfect cached page,” it’s to make sure search engines can crawl, render, index, and rank your content. That’s the best way to ensure your site is in fighting shape when it comes to appearing in organic search.