Microsoft Clarity, the company’s tool for visualizing user experience, is out of beta
The tool provides site owners with visual heatmaps, session playbacks, filters and metrics to help them improve their user experience.
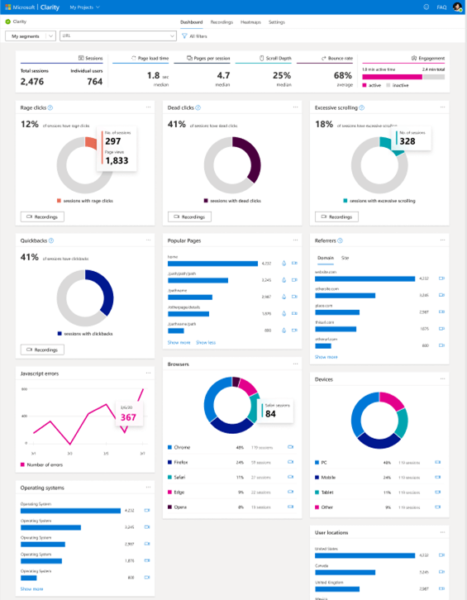
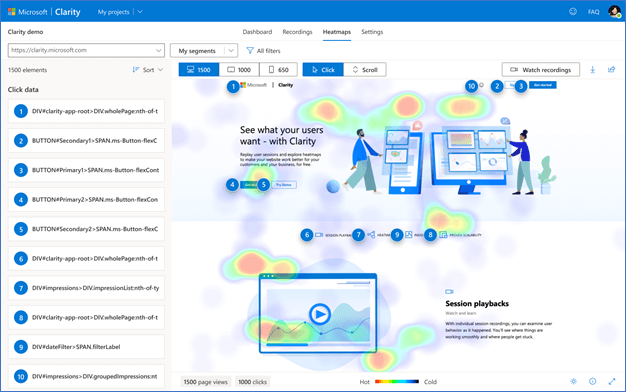
Microsoft Clarity, a free product to help site owners better understand visitor behavior so that they can improve their user experiences, is out of beta and now generally available, the company announced Wednesday. First launched as a closed beta in 2018, Microsoft Clarity provides site owners with visual heatmaps that illustrate user engagement, individual session replays, a dashboard to help them get an overall understanding of user interactions and filters to drill down on various types of interactions.
The dashboard. The Microsoft Clarity dashboard provides an overview of how many users were clicking on non-existent links, the number of users that scrolled up and down on a page in search of something they couldn’t easily locate, how much time the average user spends navigating your site and so on.

Two types of heatmaps: clickmaps and scrollmaps. Clickmaps can help point out which content on your page visitors are interacting with the most. Conversely, scrollmaps can tell you whether visitors are actually seeing the content you want them to see.

Session playbacks. The ability to view recordings of individual sessions allows site owners and designers to examine user behavior as it occurred. This may also help identify edge cases and inform better site design decisions.
Filtering mechanisms. In addition to the typical filters (timeframe, browser, OS, country, etc.), Microsoft Clarity also uses machine learning to identify “rage clicks,” “dead clicks,” and “excessive clicking” across the dashboard, session recordings and heatmaps.

“Rage clicks” are when users repeatedly click on a section of the page, presumably because they think there’s a hyperlink there when there actually isn’t. This may help distinguish parts of a page that are counterintuitive for users.
Why we care. While attracting visitors to your site is the primary objective for SEOs, that traffic isn’t going to help you meet business objectives if users can’t find what they’re looking for. Being able to identify which sections of your crucial pages are turning users away and which sections are performing well can help you improve your user experience, which can also lead to more conversions.
For example, using heatmap and scrollmap data to inform your site’s design can help to ensure that your high-value content is front and center for your users. Similarly, “rage click” information can enable you to make more intuitive pages. And, this data can be provided to stakeholders to justify design decisions.
Clarity is designed to have a low impact on your page load times, but you’ll want to test this to ensure that any additional load times aren’t a significant factor for your users.
Contributing authors are invited to create content for Search Engine Land and are chosen for their expertise and contribution to the search community. Our contributors work under the oversight of the editorial staff and contributions are checked for quality and relevance to our readers. Search Engine Land is owned by Semrush. Contributor was not asked to make any direct or indirect mentions of Semrush. The opinions they express are their own.


