Analyzing Competitiveness In Your Paid Search Account
The auction-based industry we work in involves a number of metrics which help search marketers identify where they are doing better or worse than the competition. Just to name a few, the most common metrics search marketers usually look at are the Quality Score (QS), the average cost-per-click (CPC), the impression share (IS), and the […]
The auction-based industry we work in involves a number of metrics which help search marketers identify where they are doing better or worse than the competition. Just to name a few, the most common metrics search marketers usually look at are the Quality Score (QS), the average cost-per-click (CPC), the impression share (IS), and the ‘Relative CTR’ on the Google Display Network.
While the Quality Score indicates whether your keywords/ads/landing pages are relevant against the competition, it does not tell much about the actual competitiveness of the market. Instead, the average cost-per-click (CPC) can help measure how competitive the auctions are, given that more competition typically causes higher CPCs. That being said, your CPC could be high because of a poor Quality Score, not necessarily because of the fierce competition out there.
In order to isolate the competitiveness component from the equation, one can measure the average delta between the max bid (what you’re willing to pay at the max) and the CPC (what search engines actually charge you). How can this delta be determined, and how actionable is it?
Calculating The Competitiveness In Your Paid Search Account

You can look at it as a ratio; and in theory, it should range from 0% if there was no click to 100% if the CPC was equal to your max bid. Obviously, the grey zone in between is what we are interested in.
Also, for the sake of this analysis, this ratio can be aggregated from the keyword to the ad group, campaign, and even AdWords label level (or any way that makes sense to your business). The aggregation is not pretty as you’ll be summing CPCs and bids; however, from my experience, it does work — especially when weighing by the number of clicks.
What should one expect to see then? Well, say you have labeled your campaigns in AdWords by trademark (your own branded terms), brands (brands that you distribute), generic (short, high-volume, non-trademark, non-branded keywords), and SKU (product-specific keywords). Then, based on multiple paid search accounts organized that way, one can expect:
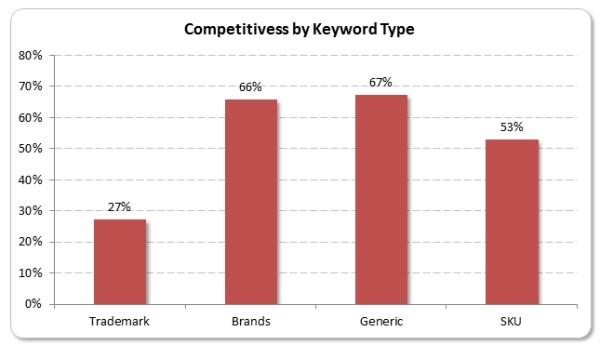
- Low competition on your trademark terms: Your CPCs should be low compared to your max bids. In the below example, our competitiveness ratio shows 27%. If your max bid is $1, you’ll be charged $0.27 on average.
- Medium to high competitiveness on products-specific keywords: 53% based on this client set.
- High competitiveness on generic and brand related keywords: 66-67% in our example.
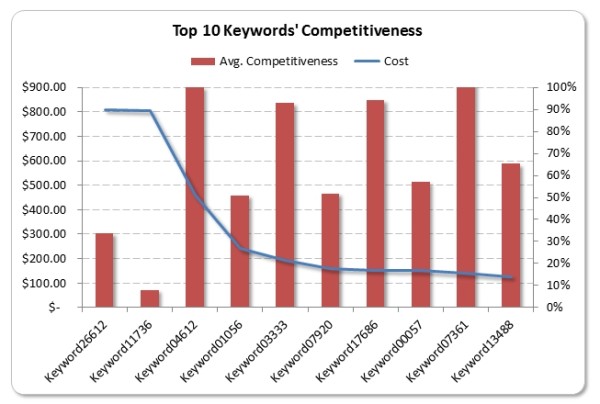
Obviously, you can visualize this ratio at the campaign, ad group, and keyword levels. too. For instance, you can look at it for your top 10 keywords from a cost standpoint – where the two first keywords on the left are obviously trademark terms:
Application #1: Bidding Strategy
Being able to determine the average delta between the CPC and the max bid is not just about putting together fancy charts — it can also be pretty powerful and actionable!
Say you’re launching new paid search campaigns, and you’re not sure about the initial bids. All you know for sure is your CPA target and your historical conversion rate for a given product category. Then, given that CPC= CPA*Conversion Rate, you can calculate your initial max bids such as:
Example:
Application #2: Identify Growth Opportunities
To simplify, a straightforward way to identify the room for growth in your paid search account is to spot those profitable keywords not already in rank 1.0 or so. You can then bid up and gain incremental conversion volume as long as profitability remains on target.
A slightly more sophisticated approach to this tactic is to also take the Quality Score into account, since you want to first get more aggressive where your keywords/ads/landing pages are the most relevant.
Similarly, search marketers can also leverage the above competitiveness indicator so that they first get the most out of those keywords where competitiveness is relatively low.
Example: if your target CPA is $40 and the average competitiveness in your account is 43%, then you might want to first bid up on those keywords with a position worse than 1.5, a CPA lower than $35, a Quality Score greater than 5, and a competitiveness lower than 40%. This logic can easily be translated into Excel using pivot table/filters and will help you get the most out of those profitable keywords where the competitiveness is below average.
Conclusions
In conjunction with a Quality Score analysis, analyzing the average delta between the CPCs and the bids can be key to determining the competitiveness in your account, adjusting your bids accordingly, and identifying opportunity keywords you want to bid up first.
Contributing authors are invited to create content for Search Engine Land and are chosen for their expertise and contribution to the search community. Our contributors work under the oversight of the editorial staff and contributions are checked for quality and relevance to our readers. The opinions they express are their own.
Related stories
New on Search Engine Land


