Develop free, lightweight attribution insights for your paid & organic channels
Looking to reallocate or reduce your paid search spend and not sure where to start? Columnist Chris Liversidge shows how you can identify opportunities by comparing your paid and organic search performance data by keyword and device.

When running paid search alongside your organic SEO strategy, it’s essential to ensure you have an integrated strategy and a consistent message in the search engine results pages (SERPs). To manage this, data analysis at the keyphrase level — for search terms where both channels are active — can improve traffic and reduce inefficient paid spend.
Usually, to perform this type of analysis, you’d need to spend six-figure sums for powerful attribution insight tools from Google or Adobe or the like. Personally, I prefer to roll my own for an admittedly less deep, quick insight tool focused just on channels visible on Google’s SERPs.
To map paid search term data to organic, start by pulling comprehensive daily data on all keyphrases driving traffic to your site from Google’s Search Console API. I’ve written about this process before on Search Engine Land, so I won’t go over old ground.
One major change to the described approach, however, is grabbing the data segmented by device. Device segmentation to mobile, tablet and desktop can be matched to AdWords data and allows like-for-like comparison of SERP click-through rate performance, which lies at the heart of our analysis.
Once you have started collecting (and storing) this data daily, mapping data to Google’s AdWords API for matched time periods and devices will enable you to discover opportunities to increase the “halo effect,” wherein a website receives increased click-throughs for both channels when paid ads are visible alongside highly ranked organic results.
Mapping this data together also helps identify opportunities to reduce paid spend cannibalizing organic results where very strong organic click-through rates are occurring.
By extending the data to pull in attribution models used in Google Analytics, you can start making significant improvements to the overall efficiency of your entire search marketing budget by repurposing inefficient spend elsewhere across multiple channels.
In effect, you have a form of lightweight Google Attribution 360 (fka Adometry) insight you can apply to your paid search channel at a fraction of the cost (in fact, for free).
Building the halo tool & running data analysis
We are combining three data sources, via three APIs: Google Search Console, Google AdWords and Google Analytics. The same analysis is perfectly possible with Adobe Analytics API, as well.
Additionally, Bing Webmaster data can be used for markets where market share is large enough to be worthwhile for analysis (looking at you, America!). Search click-through rate data are specified here.
Note: I have not tried building an equivalent analysis for Yandex, as it appears not to offer the necessary SERP impression and click data, but I would be interested in any attempts made to generate the equivalent data for Yandex in Russian markets.
As a brief walk-through, pull the Search Console data as described in my previous Search Engine Land article (shown below).
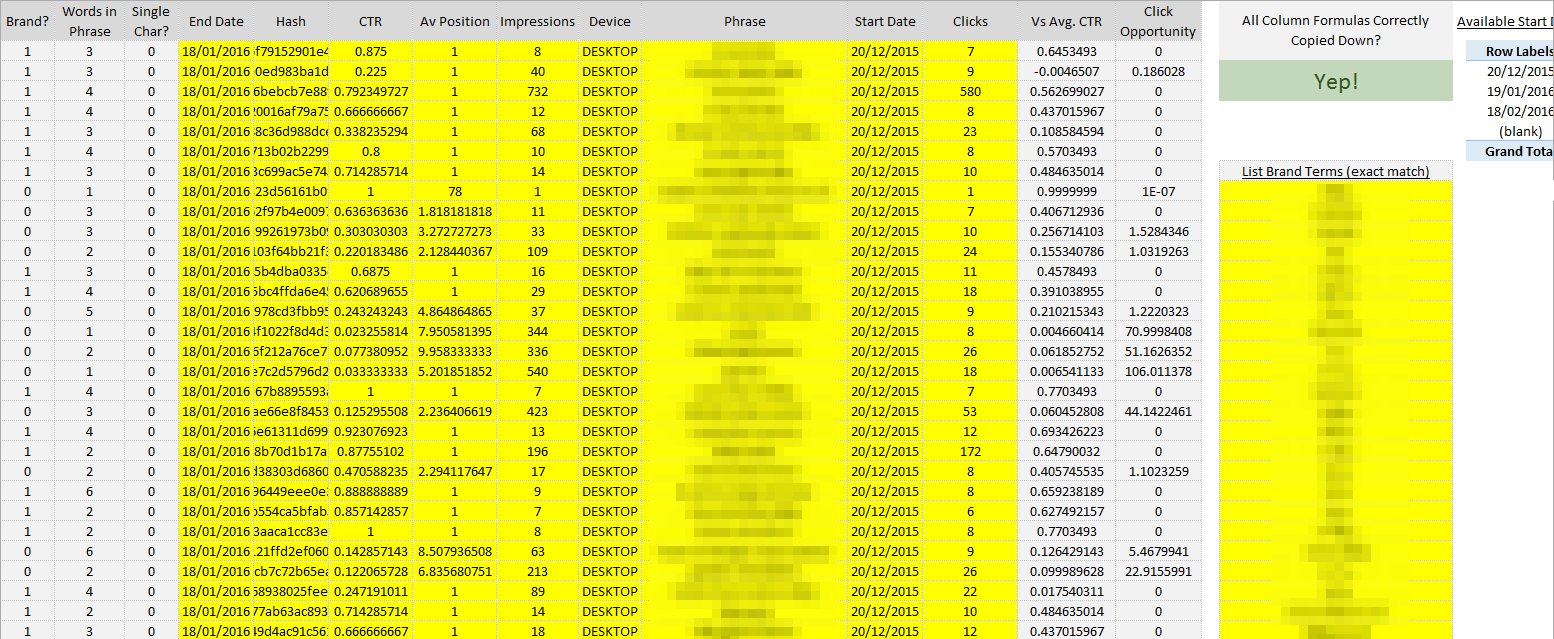
(click image to enlarge)
Then, to collect the AdWords Data, pull the data shown below via the API.

(click image to enlarge)
To allow for attribution, we now pull revenue data from Google Analytics, which means we can actually pull data for different attribution models available within Google Analytics.
For a starting point on attribution analysis suitability and approach, I recommend Avinash Kaushik’s primer on the topic.
Here is what the Analytics data pulled looks like.
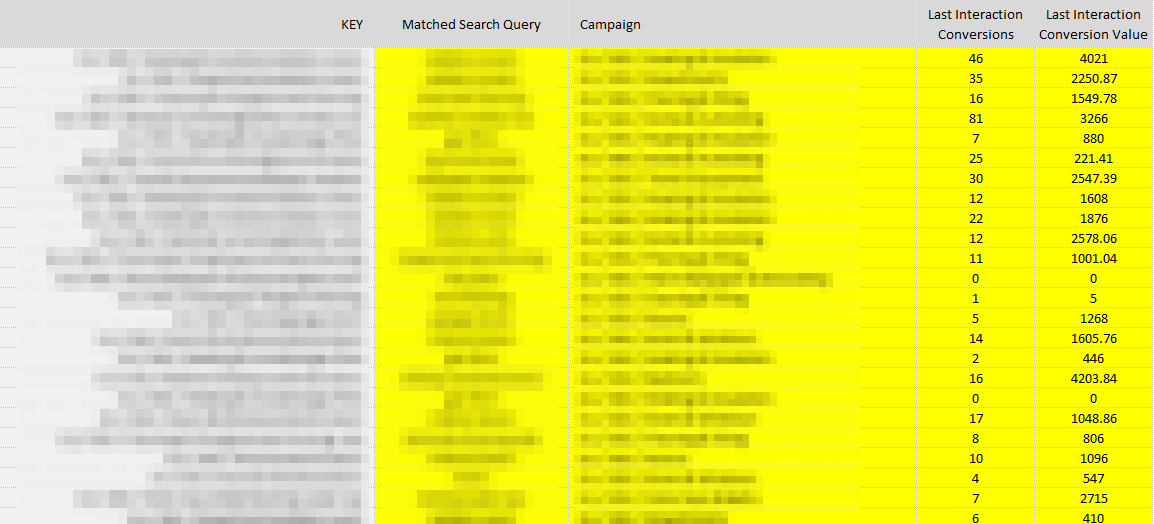
(click image to enlarge)
Now, we get our pivot tables out. I typically create two pivot tables from the three sets of data: one to allow for sorting by different priorities for the most recent time period (the last day, week, fortnight or month, depending on your preference)…

(click image to enlarge)
… and another to look up historic data for comparison with the first time period.

(click image to enlarge)
Then, create a new tab in Excel, and style up a report which pulls data from the first Pivot prioritizing paid spend like this:
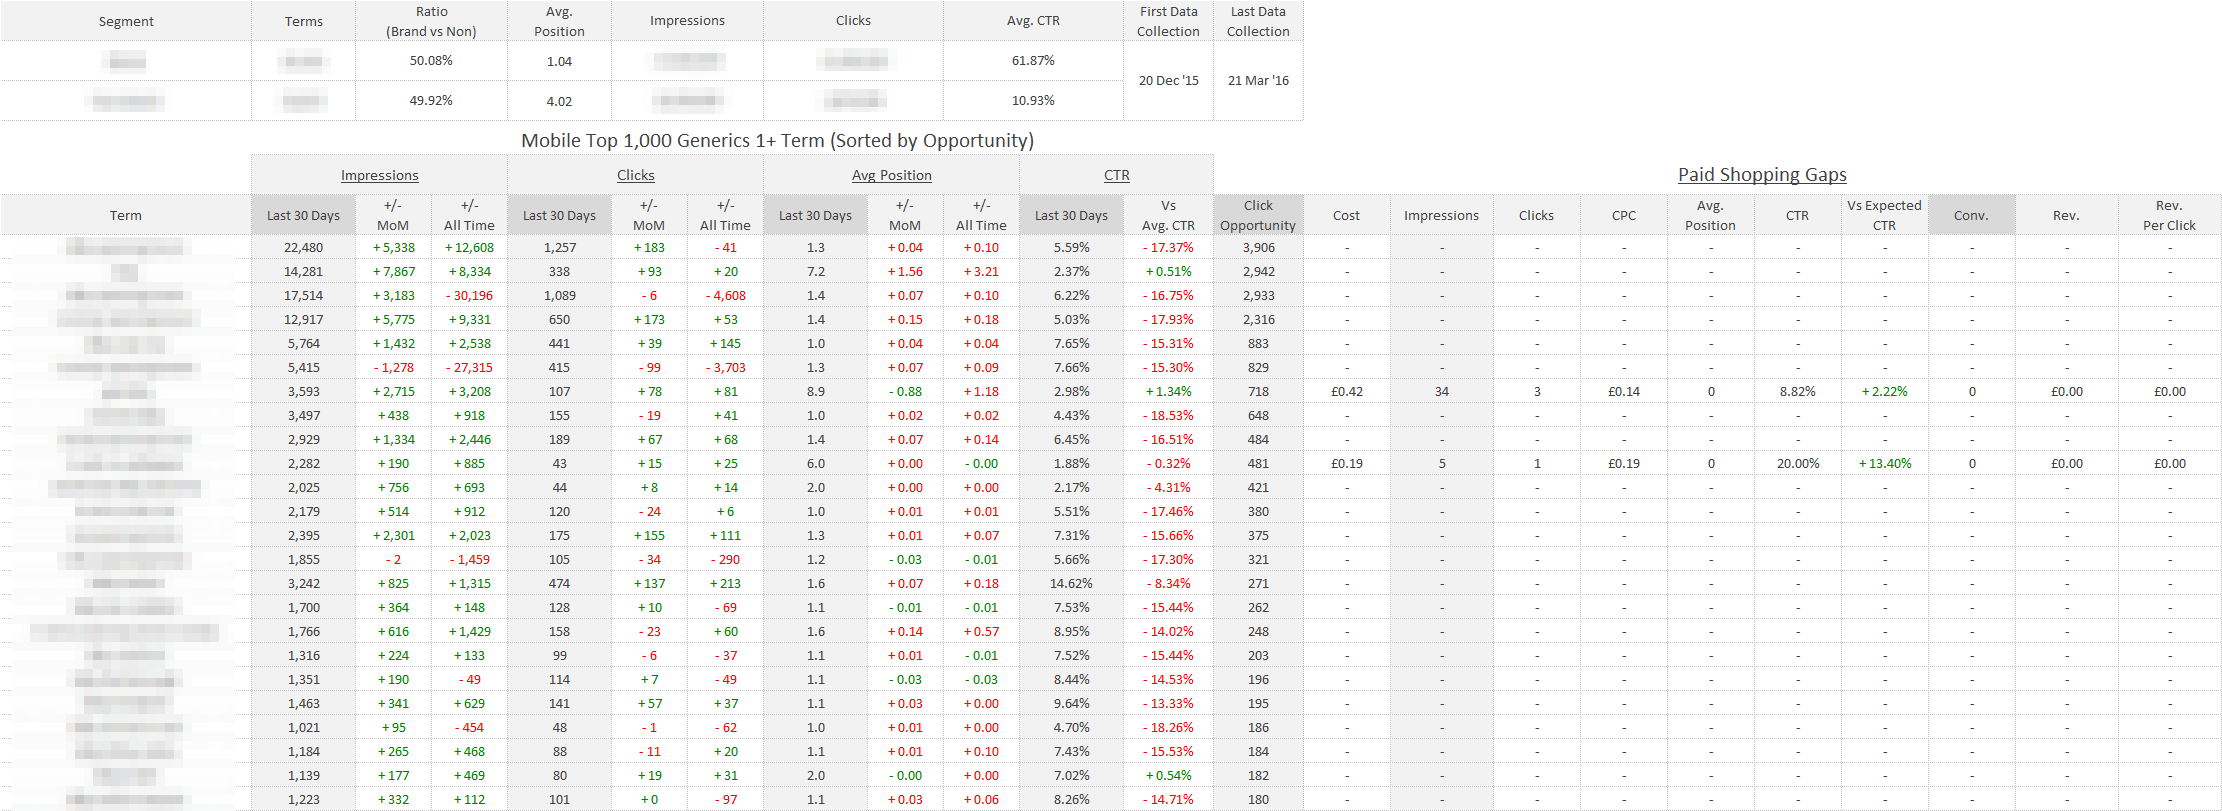
(click image to enlarge)
And then also create one prioritizing organic performance like this:
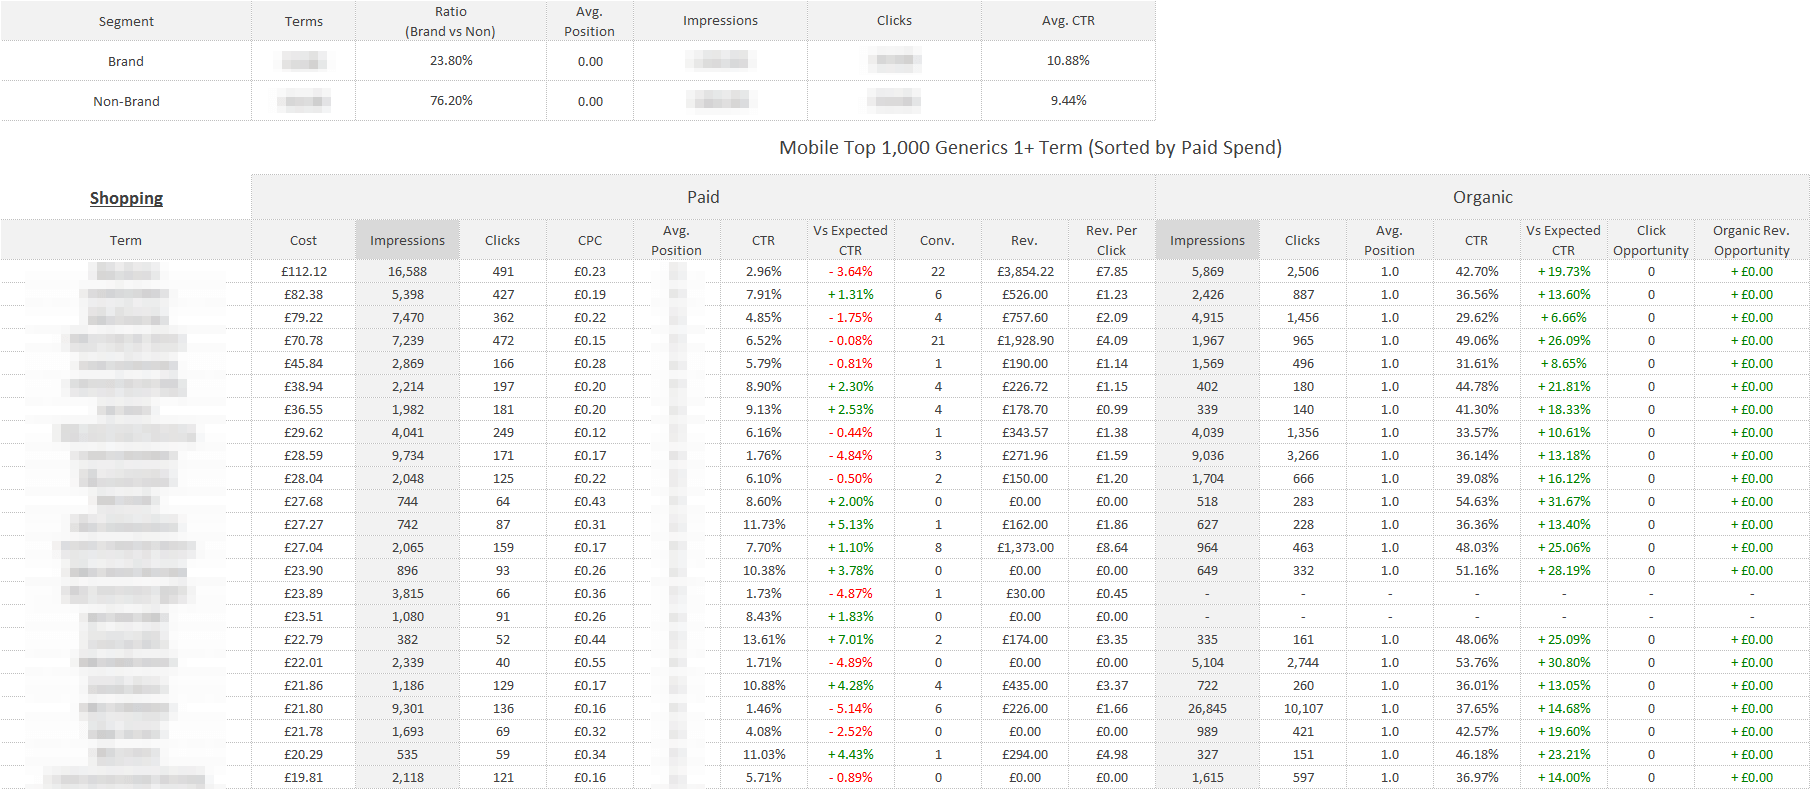
(click image to enlarge)
Because we are calculating the number of terms in each phrase, we can create reports to the “fat head,” “chunky middle” and “long-tail” terms in our data. We segment by device at all times to compare like with like. And because we have spend and revenue data alongside our click-though rate (CTR), we can see where our opportunities to save spend lie.
To (very simply) illustrate this, see the report snapshot above showing brand terms with AdWords PLA spend against them. In this example, roughly £8,000 per month is being spent on those top 1,000 terms.
Given we have a greater than 50 percent above expected click-through rate for organic across 90 percent of those terms, we can test switching off that budget. We have more than 200,000 terms in our data set, so there’s plenty more opportunity to be found.
To understand if the budget was cannibalizing organic traffic, we re-run the report the next day, week or fortnight and confirm that we have the same overall traffic coming through.
When you are confirming conversion and revenue, with sound attribution models, then you should expect to run reports against individual products or categories and measure the overall revenue impact of pulling out paid spend. If your overall revenues are unchanged, then you can safely move that budget elsewhere.
In this way, you can drill through the highest spend areas of your account to find overlap or “cannibalization” opportunities to test, increasing the efficiency of your search marketing campaign.
Contributing authors are invited to create content for Search Engine Land and are chosen for their expertise and contribution to the search community. Our contributors work under the oversight of the editorial staff and contributions are checked for quality and relevance to our readers. The opinions they express are their own.
Related stories
New on Search Engine Land
About the author