Traffic: How To Analyze Quantity Vs. Quality
Google has released some great traffic-boosting campaign types over the last year, such as dynamic search ads and product listing ads (PLAs). While it’s great to be bringing in this additional traffic year-on-year, it’s important to analyse this traffic increase against Analytics metrics to ensure that the quality of your traffic is also improving. Are […]
Google has released some great traffic-boosting campaign types over the last year, such as dynamic search ads and product listing ads (PLAs). While it’s great to be bringing in this additional traffic year-on-year, it’s important to analyse this traffic increase against Analytics metrics to ensure that the quality of your traffic is also improving.
Are You Checking Your Year-On-Year Data?
It is easy to get distracted with week-on-week and month-on-month data, but you really should be looking at the bigger picture and seeing what’s going on year-on-year. If you’re not sure how to go about checking this easily, I suggest using the compare dates feature within AdWords. You’ll find this under the date drop-down and can select the settings as shown below in step 1.
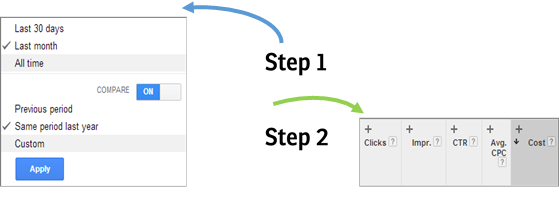
Step 2 is then to use the plus expansion boxes to look at your year-on-year data and check what’s going on in your campaigns.
This will show you top-level data as well as data for each of your campaigns, so you can compare on a campaign level if traffic has gone up overall and also see where you might not be bringing in as much traffic as the previous year.
Why Your Traffic Should Be Up Year-On-Year
This could be due to increased budgets in line with a competitive landscape, adding in new campaigns such as dynamic search ads which bring in plenty of additional traffic, making use of features such as product listing ads, having additional campaigns for new areas of business… the list can go on.
The question is: have you assessed whether the quality of this traffic is an improvement on the previous year?
How To Check If Your Quality Has Improved
What is “good quality” traffic? This is relative to your own goals, of course. Checking to see if you have made year-on-year improvements in certain metrics (see below) would be a good place to start your judgments.
A massively underused feature within AdWords is the ability to pull in Google Analytics metrics. Here’s a bit more info on the metrics you can see and what you should be looking for as signs of quality improvement.
Bounce Rate

Bounce rate is an indication of the percentage of people who have come to your site and either exited right away or did not go on to view another page. If your traffic is up year-on-year and your bounce rate is up as well, then this indicates that people who are coming to the site this year are less interested in the pages you’re sending them to.
If this is the case, then you’ll want to look at the campaign-level data to see which campaign is bringing in the traffic with the higher bounce rate. This could be due to adding in campaigns such as dynamic search ads, where you don’t have as much control over the keywords and landing pages that you’re targeting, but you can gain increased traffic at a low cost-per-click.
You can even drill down to the ad groups that are yielding higher bounce rates and adjust the keywords and ad copy in order to bring in a more relevant audience. Consider sending your ads to different landing pages to see which one yields the lower bounce rate, and then you can roll this out to further ad groups.

In the example above, bounce rate had slightly increased year-on-year, but this small a percentage change shouldn’t worry you too much. If the change was more than 10%, then I’d start to think about what changes need to be made to the targeting or the site in order to reduce bounce. It’s important to keep an eye on this metric as it’s probably one of the best indicators of whether you’re sending the right traffic to the right landing page, and you can easily test out new strategies to bring this down again.
Average Visit Duration

This metric tells you how long people spent on your site on average and is measured in seconds. If you’ve launched new ad groups or campaigns, you should be checking to ensure that your visitors are spending enough time on site. If year-on-year, your average time on site has decreased from 3 minutes to 2 minutes, for example, then you need to assess how relevant you are to your consumer.
It could be that you need to change your targeting or simply that you need to make changes to your landing pages. Updating and refreshing your content can make people want to stay on your site longer. Try to think of anything you did differently the year before or if you have made any major changes to your site.
If you want to go even further than this, you could check the site search functionality within Analytics to see if people are searching for something when they get to your site but not finding it. If you operate in a market which has fast-paced product churn, perhaps you don’t have that top seller that you did last year and this is why time on site is down.

In the example above, average visit duration is up by 35 seconds year-on-year. Is this a good thing or a bad thing for this advertiser? It’s not necessarily always a good thing that people spend longer visits on your site.
If they’re spending too long on your site, it could be that they’re not finding what they’re looking for! In this case, I’m using data from a client in the travel industry where one would expect potential customers to be browsing and reading information about the different travel options on offer, so I would count it as a good result year-on-year that this metric is up by 13%.
If, however, you’re an e-commerce client and you know that if someone comes to your site, landing on the specific product they were looking for and can check out in 3 easy steps due to improvements you’ve made to your site, then perhaps a decrease in this metric would be a great success for you!
Pages/Visit

This metric is important as it tells you how many pages people are viewing on average when they get to your site. If your website involves purchasing something where people have to go through a few pages in order to complete the purchase or contact you, then ideally your average should be more than a few pages.
If your average page view number is down year-on-year, this could suggest one of several possibilities. It could mean that you assessed your purchasing funnel or search navigation on the site and made changes for the better, allowing visitors to find things more easily and reach conversion goals faster. Or, it could mean that people are not interested in the landing pages you are now sending them to, and you need to refresh your site and make some changes to your navigation to encourage people to view more than one page of content.
There are many factors that will influence this metric, so it’s important to do a thorough analysis. For example, if you recently added a phone number to your site, you may find that people only need to view one page and then call. Make sure you’re taking all these factors into consideration when assessing the quality of traffic increase or decrease.
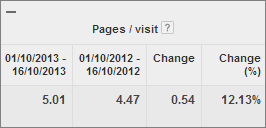
In the example above, our average pages per visit has increased by 0.54 year on year. Given that this is from the travel industry, this indicates better traffic for us — the visitors are more engaged with our content and wanting to view more pages because of it. Success!
% New Visits

This is an interesting one as it lets you know the percentage of visitors your campaigns are bringing in that are new to your site. If you’ve been doing a lot more remarketing activity this year (or a lot less), then this may be skewing your new visitor numbers year-on-year. It’s always interesting to compare these figures to see if your market is becoming saturated or not, and to help determine if you need to try some new angles or new ad groups to bring in new blood to the site.
With the amazing strategies you can add onto your search campaigns now surrounding Remarketing Lists for Search Ads (RLSA), it is easy to solely focus on getting people to return to your site. But ideally, you still want to be driving plenty of new visitors to your site via PPC. If your new visitors are down year-on-year, then I suggest identifying the campaign areas/types that have been performing well (in terms of the other metrics we’ve discussed) and expanding those activities to drive more high quality traffic.

In our example here, new visitors are down by a significant percentage. We’ve been using more budget year-on-year for things like remarketing and RLSA, so it’s not surprising that our new visitor numbers are down.
In order to improve this metrics, I’d be looking to facilitate more budget to be able to push new visitors, and I’d perhaps consider utilizing display as a tactic (provided the quality of the traffic is good).
These Metrics Aren’t Just For Search Activity!
You can also use these metrics to analyze your display campaigns within AdWords. Display campaigns often bring in lower conversion volumes than search campaigns, so using these additional metrics to ascertain if the volume of traffic you’re receiving is of a high quality in comparison to your search campaigns is best practice. This will help you determine future strategies and decide if you should suspend certain areas of your campaign.
Which Is Better: Quality Or Quantity?
The answer to this question really depends on your business goals. How useful the above analysis will be to you all depends on the type of site you have, the conversion tracking you have in place, the types of campaigns you’re running, and other external factors (such as site redesigns, etc.).
Let’s say you are using conversion tracking in combination with these quality metrics. If you’re seeing additional traffic coming in year-on-year and your conversion rate has also increased, then you’re on track. If, however, you find that you’re getting more traffic in this year but your conversion rates are down or below expectations, then it would be worth delving into the quality of your traffic and analyzing the key differences between the areas outlined above year-on-year.
Most of these lead to the same points that you need to think about all the time in paid search: do you need to make changes to the terms you’re advertising on, the wording in your ads, or the landing pages and their content? Now’s the time to get delving into your year-on year-data to start making improvements!
Contributing authors are invited to create content for Search Engine Land and are chosen for their expertise and contribution to the search community. Our contributors work under the oversight of the editorial staff and contributions are checked for quality and relevance to our readers. The opinions they express are their own.
Related stories
New on Search Engine Land
About the author