Google Ads is showing advertisers how their spending compares with peers
Google Ads’ new Spend Benchmarks report shows advertisers how their budgets and clicks compare with similar businesses

Google Ads’ new Spend Benchmarks report shows advertisers how their budgets and clicks compare with similar businesses

Primary research is rare, but it earns 3.3x more AI citations per page. Learn why benchmark studies outperform other original data.

Track SEO progress with confidence. Learn how benchmarking reveals gaps, sets goals, and helps you stay ahead of competitors in search rankings.
Google Analytics now lets businesses benchmark absolute metrics like New Users and Total Revenue.
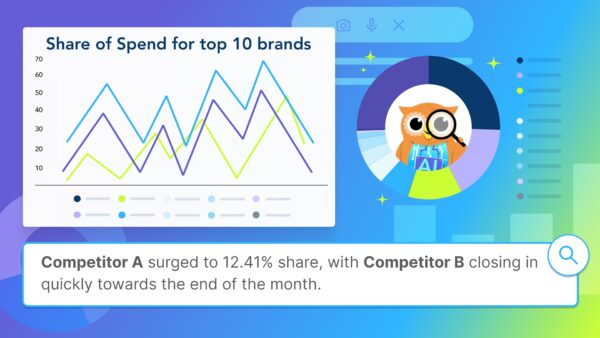
Benchmark your Google Ads performance, reveal growth opportunities, and leave competitors behind with Adthena’s PPC Market Share Reports.

New industry benchmarks reveal what success really looks like.

Are your landing pages converting better—or worse—than your competitors’? See the latest conversion benchmarks by industry.

Learn the fundamentals of SEO benchmarking, from gathering data to identifying growth opportunities to stay ahead in 2025.
You can now compare your performance across key metrics with industry peers, providing crucial context for strategic decision-making.

Benchmark PPC competitors across ad networks like Google and Meta and identify top channels, creatives and landing page experiences.
Last updated January 2025 In Q4 2024, the average CTR was 0.63% (averaging across all countries, platforms, and industries), according to our research. While easy answers are always nice this overall CTR benchmark is not that useful, unfortunately, as results vary so much depending on your particular activity. The key is to break it down. […]
Last updated January 2025 In Q4 2024, the average Engagement Rate was 3.53% (averaging across all countries, platforms, and industries), according to our research. As each social network has different averages, use our Engagement Rate Benchmarks to drill down into results and check the performance of your posts and ads against thousands of other marketers. […]

Last updated January 2025 In Q4 2024, the average Conversion Rate was 4.8% (averaging across all countries, platforms, and industries) according to our research. This overall average benchmark is limited in its usefulness. To find results more relevant to yours, use our Conversion Rate Benchmark Tool to check the performance of your channels against thousands […]

Last updated July 2024 Last quarter the average Facebook Engagement Rate was 4.63% (averaging across all countries, channels, and industries) according to our research. This benchmark combines both organic and paid activity. Use our Facebook Engagement Rate Benchmarks to drill down into the performance of your posts and ads. Compare your recent engagement rate to […]
Last updated July 2024 In Q2 2024, the average Paid Social CTR was 0.97% (averaging across all countries, platforms, and industries), according to our research. Use our Paid Social CTR Benchmarks to compare the performance of your campaigns to others. Top Tip: CTR is a more useful measure than the number of clicks as it […]
Last updated July 2024 According to our research, the average Paid Search CTR in Q2 2024 was 2.41% (averaging across all countries, platforms, and industries). This is the headline figure, though – results can vary hugely depending on circumstances. Find results more comparable to your campaigns by using the filters on the Paid Search CTR […]
Last updated July 2024 In Q2 2024, the average Display Ads CTR was 0.27% (averaging across all countries, platforms, and industries), according to our research. Drill down on our Display Ads CTR Benchmarks to check the performance of your campaigns against thousands of others. Compare your recent CTR changes to trends that are relevant to […]

If you are looking for trends, or simply to compare your results to others then our benchmark tools are for you. We’ve gathered and processed data to give you running averages across all the most important online advertising metrics. Each benchmark can be broken down so that you can find information that reflects your own […]

The findings come from an analysis of 2.4 million local listings in over 30 business categories.

Google Analytics announced today its new benchmark reports will be rolling out over the next few weeks, allowing users to compare their results to industry standard acquisition and engagement metrics. According to the announcement, users can select reports from among 1,600 industry categories, 1,250 markets and seven size-buckets, with metrics by channel, location, or device […]

Yelp has long maintained that the company has one of the best (if not the best) local data sets out there. There are third parties that have come up with findings that don’t agree with that claim. Recently, Yelp decided to take matters into its own hands and benchmark itself and the quality of its local […]

Google is introducing “The Customer Journey to Online Purchase” analytics report today, a new benchmarking tool that provides insight into the various elements impacting a single campaign. You can learn more about it in a short write-up at our sister site, Marketing Land: New Google Analytics Path To Purchase Report Provides Benchmark Data On 11 Different […]
The Google Analytics Benchmarking feature is now live for those users who have chosen to opt in to the program. You can access the data by visiting a site profile and clicking on “Visitors” and then on “Benchmarking (Beta).” Google said that the current list of “verticals and the quality of the data will likely […]
Google Analytics added a new benchmarking feature today. Users can now compare their site’s performance to industry benchmarks, though only if they agree to share their data to help produce such aggregate benchmarks. Another feature added is the ability to see when your Google Audio ads run, in relation to your web site traffic.