How to Identify The Impact Of Mobilegeddon & Future Mobile Algorithm Updates
Have you seen a drop in mobile rankings since the search giant rolled out its mobile-friendly algorithm? Columnist Ben Goodsell explains the steps to determine if Mobilegeddon, or another factor, is the cause.

The new Google mobile algorithm has arrived in all its fury, and everyone seems a little disappointed in the change that failed to rival Panda.
Entire industries were not destroyed, and even if they were, former Google head of webspam Matt Cutts isn’t around to blame anymore.
According to Google Search Console ringleader John Mueller, this is due to the fact that, while the new mobile algorithm affected a lot of queries, most sites were either:
- Already mobile friendly, or
- Changed, but not significantly enough to notice (vs. Panda where the entire site dropped in search results).
In this column, I’ll explain how to get as close as possible to finding the cause of gain or loss of mobile clicks at the page and query level using Google Search Analytics. I’ll also attempt to establish a good benchmark based on the current strength of the new Google mobile algorithm.
Strength, Stats, & Spotting The New Google Mobile Algorithm
Enterprise SEO Tool BrightEdge tracked 20,000 non-mobile friendly URLs through Mobilegeddon and two weeks later found about 17.3% of those pages were no longer seen on the first page of search results. This is much less of an effect on rankings than expected.
SearchMetrics also came out with a biggest winner/loser list, based on the difference in the mobile to desktop rankings.
The idea was that if mobile saw a gain or loss that desktop didn’t see, there’s a greater chance it was caused by the new Google mobile algorithm. This approach seemed to uncover a lot of volatility, but the methodology could be a lot more valuable when applied to the page vs. site level.
While BrightEdge data seems to be a better gauge of the true strength of Google’s mobile algo, SearchMetrics’ methodology makes sense for extracting actionable information, especially when applied at the page level.
We’ll discuss taking SearchMetrics’ idea to compare mobile trending to desktop and combine this with a more comprehensive process of elimination using Google Search Analytics data. Using these reports to get more granular, we’ll be able to understand which keyword and page combinations gained vs. lost clicks. We’ll also determine if the change was caused by a drop in search demand, a position change, or if timing indicates it was tied to the mobile algorithm.
Setting Up Search Analytics Report For Landing Page And Query Analysis Of Mobile Clicks
To begin, let’s navigate to the Search Analytics report found in the Google Search Console under the Search Traffic category, and set the following parameters.
Note: If you have a mobile site on a separate subdomain (m.example.com) you’ll have to look at mobile metrics in a separately verified Google Search Console (Webmaster Tools) account.
- Clicks
- Pages
- Countries -> United States (or country of choice)
- Devices -> Mobile
- Search Type -> Web
- Dates -> Comparison -> Custom -> Month after change compared to equivalent days on previous month (for trending).

Now that we have the report set up, you should be able to see the general trend of whether your site has gained or lost clicks month over month, pre vs. post the Google mobile algorithm change. Hopefully you fared better than the site below!
Knowing that the site lost more than it gained, we can see which pages contributed most to the loss by clicking the Difference column header twice and sorting accordingly.

Now that the URLs that were most responsible for the loss have been identified, we can click on the URL to have the report filter for that specific URL.

Now by clicking Queries, we can see the specific keywords for which the URL comes up in search results. Once again sort the Difference column by clicking the column header to find the keyword associated with the landing page that is most responsible for the gain or loss you are looking for.
In the image below, you can see there’s one keyword in particular responsible for over 50% of the loss for the URL.

It’s possible to filter the report yet one step further by clicking the specific query of interest. Now we begin the process of elimination to determine whether the Google mobile algo caused the drop of this particular keyword and landing page combination.
Search Analytics Process Of Elimination To Identify Cause Of Gain Or Loss Of Clicks
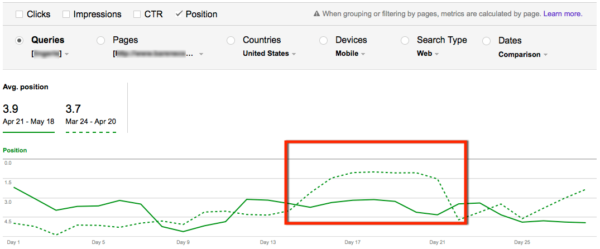
Take a look at click trending to identify outstanding patterns and note when they occur.

Next click Position to see if it remained steady during noted outstanding patterns. In this case Position directly correlates with the month-over-month loss of Clicks.
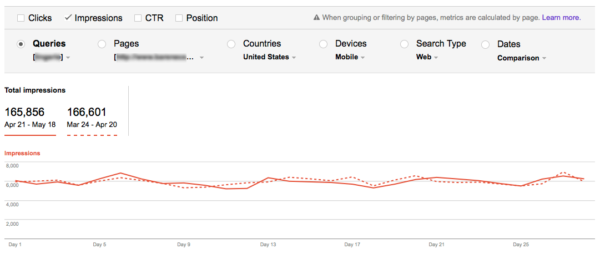
Looking at Impressions to understand the volume of search that occurred, we can see that it remained about the same.
Taking a closer look at when this jump in Clicks and Position occurred for this particular landing page keyword combo, it’s clear that timing was well before the release of Google’s mobile algorithm and the loss is due to the lack of the same jump in rankings this month.
From here it’s possible to look at what change occurred on the SERP or SEO metrics for the landing page during that time frame for more insight.
While this only accounts for a fraction of total loss, by repeating this process it’s possible to start chipping away at the biggest winner/loser landing pages to answer the never-ending client question of, “WHY??”.
Possible Mobile Algorithm Hit Example – Search Analytics Process Of Elimination
Another way to look for possible algorithm hits is to check first for position, by looking at the worst instances of rank loss.
Begin by configuring the report the same as above, but this time check Position in addition to Clicks. Next sort by the post algorithm date range to see pages that received the most clicks, and suffered a loss in ranking.

Dive in by filtering same as before, by clicking the URL to get a closer look at the landing page most responsible for the gain or loss. Here we can see a major loss for this page and all associated queries, right around the time of the algorithm release.

Finally circling back to SearchMetrics methodology, make sure the change was only seen on mobile (vs. desktop). As a last check, change Devices to Desktop and verify the drop is unique to Mobile.

Conclusion
Ever since Panda, Google has been taking a less ham-fisted approach to updating the way it shows search results to users. Even if your site is “mobile-friendly,” performing this analysis will help you ensure it stays that way in the eyes of Google as the company continues to tweak the algorithm.
While this alteration to mobile search results wasn’t huge, Google will continue to raise the bar for what it considers to be mobile-friendly (including page speed), and that will be reflected in the algorithm. Even for those who are already “mobile-friendly,” it will continue to be important to identify problem pages based on historical data. We hope this tutorial can be a good start in helping you accomplish this efficiently in the future.
Note: It’s important to always keep in mind the quirks and nuances of the tools you’re using. Google Search Console/Search Analytics reports are no exception (2,000 top daily query limit, sampling of downloads, buggy charts, etc.). We believe they can be used to help guide insights and are increasingly becoming more accurate. Google has released documentation addressing many concerns about how Impressions and Position averages are counted. This report is still in beta, and you can give feedback and report bugs here. Knowing how and when the data is stored and some of the calculations behind them can help you understand what is a solid trend worthy of forming a strategy around. Always find additional examples and verify trends in other tools like Analytics.
One Final Pro Tip: The new Search Analytics URLs are structured in such a way that it’s easy to share or quickly change sites without losing filters and date ranges.
Just copy the URL, switch out the domain name, and paste into a browser or tab that is signed into the proper account and it will keep the specified filters. This makes it easy to pull up the same report for many sites quickly.

Contributing authors are invited to create content for Search Engine Land and are chosen for their expertise and contribution to the search community. Our contributors work under the oversight of the editorial staff and contributions are checked for quality and relevance to our readers. The opinions they express are their own.
Related stories
About the author