YP: Restaurants Remains Top Local Search Heading, Medical The Top-Spending Ad Category
Local publisher and ad network YP (the private-equity owned combination of AT&T Interactive and AT&T Advertising Solutions) has released its US-focused Q2 “Local Insights Report.” The data in the report are derived from searches conducted across the company’s multi-platform network: “563 million searches and nearly 11 billion impressions in Q1 2012 across the YP Local Ad Network’s 300+ online, mobile, […]

As an editorial aside, it’s too bad we don’t get this sort of data from Google (or Bing) on a regular basis. But we do get reports like this from several other companies, including YP, xAd, JiWire and Verve Wireless, giving us a window into local and mobile search categories and queries, which can largely be extrapolated to the market as a whole.
The YP report reveals the top local search categories (across all platforms), as well as the top growth categories (Q1 2012 vs. Q4 2011). Once again restaurants is the top overall local category in terms of query volume.
In looking at advertiser spending, however, the list is somewhat different. While there’s a general correspondence between consumer query volumes (above) and top advertiser categories, they don’t line up directly.
Here are the top spending local advertiser categories (PC and mobile):
- Medical (i.e., Dentists, Physicians & Surgeons, and Optometrists)
- Contractors & Construction
- Legal Services (used to be number one)
- Automotive
- Home Maintenance Services (i.e., Landscaping, HVAC, Maintenance and Cleaning Services)
- Materials, Equipment & Supplies
- Financial Services
- Pet & Animal
- Moving & Storage
- Real Estate
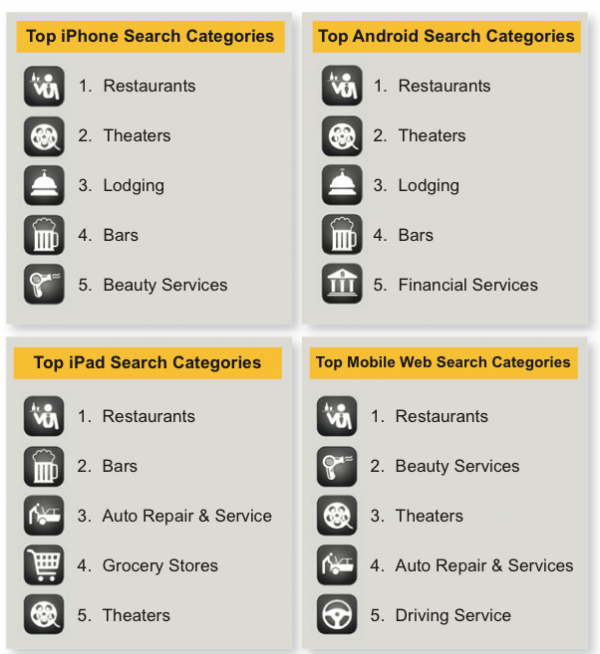
In terms of mobile-only and tablet queries, YP shows us the top search categories by OS. The company also said that it is seeing considerable growth in mobile web searches (vs mobile apps):
The number of local searches performed via mobile web increased 72 percent from the previous quarter and was nearly equal to those made across all of the YP apps. iPad searches continue to grow at an average of 14 percent every month. Fueled by the March release of the third generation iPad, these searches jumped 43 percent from the previous quarter.
The top five local search categories are generally similar across operating systems. Even though the iPad is often used as a PC substitute, largely at home, its list looks more like it comes from a smartphone than a PC.
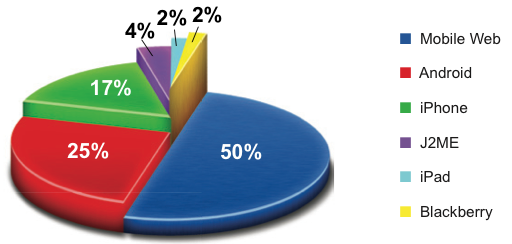
Below is a chart reflecting the mobile device mix on the YP network. Generally the iPhone drives more traffic than Android devices; however the YP breakdown below is more consistent with Android vs. iPhone market share. The report doesn’t discuss which devices are generating its “mobile web” traffic however.
YP indicated that its fastest growing mobile categories from Q4 to Q1 were: 1) wedding planning, 2) hardware stores and 3) outdoor recreation. This is no doubt somewhat seasonal but it also suggests the diversification of local-mobile search as it starts to “mature” a bit.
Finally the most active mobile search cities in Q1 2012 (in terms of queries per capita) were the following:
- San Francisco, CA
- Lafayette, LA
- Baton Rouge, LA
- Orlando, FL
- Columbia, SC
- Birmingham, AL
- Miami, FL
- St. Louis, MO
- West Palm Beach, FL
- Shreveport, LA
- Atlanta, GA
- Orlando, FL
- Miami, FL
- Richardson, TX
- Columbia, SC
- St. Louis, MO
- Tampa, FL
- West Palm Beach, FL
- Ft. Lauderdale, FL
- Birmingham, AL
The full report is available here (.pdf)
Opinions expressed in this article are those of the guest author and not necessarily Search Engine Land. Staff authors are listed here.
Related stories
New on Search Engine Land


