Give Yourself A Grade In AdWords
Columnist Frederick Vallaeys shares his favorite tools and methods for evaluating your AdWords performance.
AdWords itself doesn’t hand out grades to marketers (except perhaps account Quality Score), but tools like Wordstream’s AdWords Grader gives advertisers a consolidated grade for how they’re doing. It makes sense that Google doesn’t score marketers directly because assessing performance should be a nuanced endeavor that accounts for many factors that tie into your campaign’s profitability.
That said, people are competitive and love to win — and that means keeping score. Additionally, sometimes keeping track of scores like these can help you identify issues for further investigation.
So, here are a couple of my favorite ratios, scores, and grades that help measure your performance. I won’t cover the obvious KPI-based ratios like CPA, ROAS, or conversion rate; instead, I’ll focus on scores that you can calculate using your own AdWords data. And to help you keep score automatically every single day, I’ll share a few AdWords scripts that you can copy and paste into your account.
Lin-Rodnitzky (L/R) Score
The Lin Rodnitzky score was created by the two founders of PPC Associates (now 3Q Digital), Will Lin and David Rodnitzky, who is a contributor on this blog. One of my favorite write-ups of this ratio comes from Wijnand Meijer in his series on auditing AdWords.
The L/R score compares the CPA of converting queries to the overall CPA for search campaigns in the account. By dividing the two (total CPA / CPA of queries with at least 1 conversion), we get the L/R ratio. According to Rodnitzky, a score between 1.5 and 2 is generally indicative of a well-managed account but this has to be taken with a huge grain of salt because in an ROAS focused campaign, CPA data alone is not enough.
A lower score may indicate that the account is not aggressive enough whereas a higher score may indicate there is wasted spend with too much traffic coming on irrelevant queries.
The score aims to measure how well the account manager is balancing the need to find new queries against the need to control wasted spend through negative keywords. A conservative account manager with a low L/R score may be relying too much on exact match keywords thereby reducing their ability to discover new good queries.
Given that Google said last week that 15% of queries are new every day (the statement was made during the AdWords livestream), it’s still very important to use match types other than exact. An account manager who uses broader match types but doesn’t address poor quality queries with negative keywords would likely see a high L/R score.
One twist to the L/R score is that it was created before shopping campaigns and PLAs were introduced. It is my opinion that the score is most useful when scores for search campaigns and shopping campaigns are calculated separately because they each have different optimization techniques and it’s useful to be able to measure progress separately for each.
To make it easier to calculate the L/R score I wrote an AdWords Script that even works for accounts that have shopping campaigns. You can download it for free from Optmyzr.
Vallaeys Shopping Efficiency Score
Because the L/R ratio was created before shopping campaigns, I started to tinker with a way to get a similar score for this new campaign type and here’s what I came up with: I’m calling it the Vallaeys Shopping Efficiency (VSE) score (hey, we all need a legacy right). It’s not a measure of how good you are at finding bargains when shopping, but instead evaluates how tightly you are controlling the bids for shopping ads.
The VSE structure score, as described on our site, “calculates the ratio of ad impressions that come from product groups labeled ‘everything else in …’ versus those coming from defined product groups.” The simple notion is that highly-structured product groupings will be better managed than very loosely-structured groupings.

Don’t get too much of your volume from undefined groupings where you don’t have as much control over the bids.
A VSE score close to 100% means that a large portion of the merchant feed has been split into defined product groups — a good thing. If the score is low, it means that a large percentage of impressions come from catch-all groupings which may not give you enough control over bids needed to drive the best possible ROAS.
There’s also the VSE bid ratio, which is the cost per converted click for product groupings of ‘everything else’ divided by the cost per converted click for defined product groups. Similar to the L/R ratio, this ratio indicates if the account is fully capitalizing on opportunities without being wasteful.
These ratios are not easy to calculate manually so I’ve written a free script for this one too. You can download it here. The script also includes a list of product groupings that have either too few conversions which makes it hard to determine good bids, or so many conversions that it could be possible to divide the groupings more granularly to improve bid control further.
This is a new ratio and a work in progress so I’d love to hear how you think I can make it more useful.
Account Quality (QS) Score
Account QS is the closest thing advertisers have to a score of how well they’re managing AdWords by Google’s relevancy standards.
Google’s Chief Economist Hal Varian published a white paper about a year ago that said there is no account QS. I agree that there is no such score that a Google rep could give to you, but I believe the company does evaluate account quality — because in a machine learning system like Google’s QS, the historical performance of everything that happened in the account (i.e. account-level) impacts its prediction of future events.
Hence if you’ve gotten a lot of impressions with a low QS, that will guide the algorithm’s prediction of your future QS. In other words, your aggregate historical performance influences your future results.
Calculating account QS manually can be done but it takes dedication and it’s not likely you’ll want to do this daily. There are many scripts and tools (some of which I’ve written) that automate this task and here’s one from SEL contributor Russell Savage.
Like all the other metrics, it doesn’t weigh every factor that matters to your business (I have yet to meet a board of directors who want to discuss QS) so it must be considered carefully before you allow it to influence actions in an account.
But like all the other ratios, it’s nice to track it over time as one factor to inform yourself of how things are progressing. If you want to know more about QS from someone who worked on it, here’s one of my original posts on SEL about QS.
Percent Of Ad Groups That Are Missing Something
Last month I covered how to use Dimension reports to optimize AdWords but I didn’t realize at the time that the Campaign Details report was not released to all accounts yet. If you looked for it last month and couldn’t find it, it should now be available.
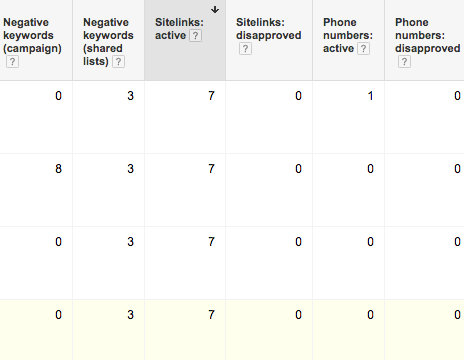
This report can be used to calculate the ratio of campaigns or ad groups that have fewer than a target number of sitelinks, negative keywords, or other elements that are usually indicative of good account management. For example: ad groups with fewer than 4 sitelinks divided by all ad groups. In this example, the lower the number, the better.
When using the campaign dimension report, double check if each stat also includes data from the ad groups in the campaign. For example the campaign report doesn’t reflect the number of sitelinks that are set at the ad group level so it could give incorrect results if you don’t consider this.
Use the campaign details report to find the ratio of campaigns that are not fully taking advantage of all the latest features like bid adjustments, or ad extensions.
Account Activity Score
In October 2014, AdWords added Change History columns to the interface, making it much easier than before to calculate an account activity score. While this score doesn’t evaluate the KPIs that matter the most, it can be a useful way to look at how active your account team is when it comes to keeping the account updated.
When using this method, you can assign a different number of points to the types of changes you care about most, for example 5 points for changing an ad and 1 point for changing a bid. When tracked over time and compared to account performance, it may start to tell you something about how much activity you should put in to get the right results.

Assign different point values to different types of changes to calculate an overall activity score for an AdWords account. Screenshot of Google.com taken May 7, 2015.
Conclusion
Those are five ways to give yourself a grade for how you’re doing in AdWords. You could make these part of a scorecard, an audit, or come up with a whole new score that combines these numbers in some unique way. However you decide to use these, hopefully they can guide how you spend your time when managing your account.
Opinions expressed in this article are those of the guest author and not necessarily Search Engine Land. Staff authors are listed here.
Related stories
New on Search Engine Land
About the author